
Page 92 -
P. 92
TRANSITION TO AGILE SOFTWARE DEVELOPMENT IN A LARGE-SCALE PROJECT 77
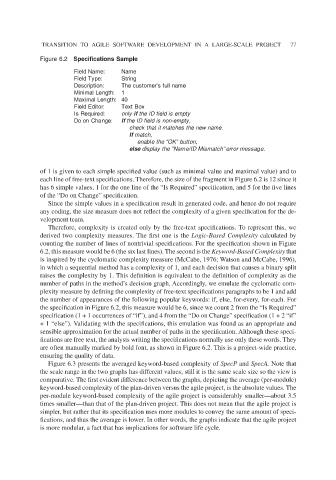
Figure 6.2 Specifications Sample
Field Name: Name
Field Type: String
Description: The customer’s full name
Minimal Length: 1
Maximal Length: 40
Field Editor: Text Box
Is Required: only if the ID field is empty
Do on Change: If the ID field is non-empty,
check that it matches the new name.
If match,
enable the “OK” button,
else display the “Name/ID Mismatch”error message.
of 1 is given to each simple specified value (such as minimal value and maximal value) and to
each line of free-text specifications. Therefore, the size of the fragment in Figure 6.2 is 12 since it
has 6 simple values, 1 for the one line of the “Is Required” specification, and 5 for the five lines
of the “Do on Change” specification.
Since the simple values in a specification result in generated code, and hence do not require
any coding, the size measure does not reflect the complexity of a given specification for the de-
velopment team.
Therefore, complexity is created only by the free-text specifications. To represent this, we
derived two complexity measures. The first one is the Logic-Based Complexity calculated by
counting the number of lines of nontrivial specifications. For the specification shown in Figure
6.2, this measure would be 6 (the six last lines). The second is the Keyword-Based Complexity that
is inspired by the cyclomatic complexity measure (McCabe, 1976; Watson and McCabe, 1996),
in which a sequential method has a complexity of 1, and each decision that causes a binary split
raises the complexity by 1. This definition is equivalent to the definition of complexity as the
number of paths in the method’s decision graph. Accordingly, we emulate the cyclomatic com-
plexity measure by defining the complexity of free-text specifications paragraphs to be 1 and add
the number of appearances of the following popular keywords: if, else, for-every, for-each. For
the specification in Figure 6.2, this measure would be 6, since we count 2 from the “Is Required”
specification (1 + 1 occurrences of “if”), and 4 from the “Do on Change” specification (1 + 2 “if”
+ 1 “else”). Validating with the specifications, this emulation was found as an appropriate and
sensible approximation for the actual number of paths in the specification. Although these speci-
fications are free text, the analysts writing the specifications normally use only these words. They
are often manually marked by bold font, as shown in Figure 6.2. This is a project-wide practice,
ensuring the quality of data.
Figure 6.3 presents the averaged keyword-based complexity of SpecP and SpecA. Note that
the scale range in the two graphs has different values; still it is the same scale size so the view is
comparative. The first evident difference between the graphs, depicting the average (per-module)
keyword-based complexity of the plan-driven versus the agile project, is the absolute values. The
per-module keyword-based complexity of the agile project is considerably smaller—about 3.5
times smaller—than that of the plan-driven project. This does not mean that the agile project is
simpler, but rather that its specification uses more modules to convey the same amount of speci-
fications, and thus the average is lower. In other words, the graphs indicate that the agile project
is more modular, a fact that has implications for software life cycle.