
Page 91 -
P. 91
76 DUBINSKY, HAZZAN, TALBY, AND KEREN
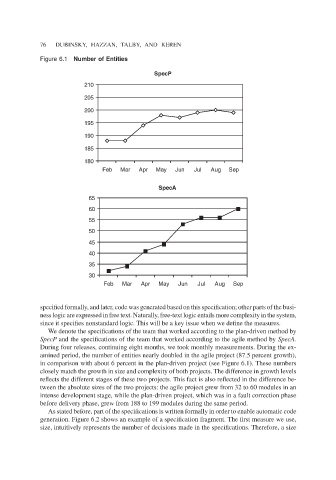
Figure 6.1 Number of Entities
SpecP
210
205
200
195
190
185
180
Feb Mar Apr May Jun Jul Aug Sep
SpecA
65
60
55
50
45
40
35
30
Feb Mar Apr May Jun Jul Aug Sep
specified formally, and later, code was generated based on this specification; other parts of the busi-
ness logic are expressed in free text. Naturally, free-text logic entails more complexity in the system,
since it specifies nonstandard logic. This will be a key issue when we define the measures.
We denote the specifications of the team that worked according to the plan-driven method by
SpecP and the specifications of the team that worked according to the agile method by SpecA.
During four releases, continuing eight months, we took monthly measurements. During the ex-
amined period, the number of entities nearly doubled in the agile project (87.5 percent growth),
in comparison with about 6 percent in the plan-driven project (see Figure 6.1). These numbers
closely match the growth in size and complexity of both projects. The difference in growth levels
reflects the different stages of these two projects. This fact is also reflected in the difference be-
tween the absolute sizes of the two projects: the agile project grew from 32 to 60 modules in an
intense development stage, while the plan-driven project, which was in a fault correction phase
before delivery phase, grew from 188 to 199 modules during the same period.
As stated before, part of the specifications is written formally in order to enable automatic code
generation. Figure 6.2 shows an example of a specification fragment. The first measure we use,
size, intuitively represents the number of decisions made in the specifications. Therefore, a size