
Page 95 -
P. 95
80 DUBINSKY, HAZZAN, TALBY, AND KEREN
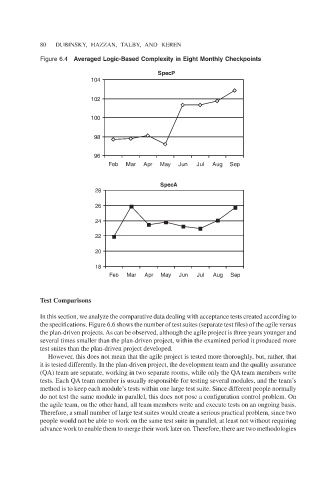
Figure 6.4 Averaged Logic-Based Complexity in Eight Monthly Checkpoints
SpecP
104
102
100
98
96
Feb Mar Apr May Jun Jul Aug Sep
SpecA
28
26
24
22
20
18
Feb Mar Apr May Jun Jul Aug Sep
Test Comparisons
In this section, we analyze the comparative data dealing with acceptance tests created according to
the specifications. Figure 6.6 shows the number of test suites (separate test files) of the agile versus
the plan-driven projects. As can be observed, although the agile project is three years younger and
several times smaller than the plan-driven project, within the examined period it produced more
test suites than the plan-driven project developed.
However, this does not mean that the agile project is tested more thoroughly, but, rather, that
it is tested differently. In the plan-driven project, the development team and the quality assurance
(QA) team are separate, working in two separate rooms, while only the QA team members write
tests. Each QA team member is usually responsible for testing several modules, and the team’s
method is to keep each module’s tests within one large test suite. Since different people normally
do not test the same module in parallel, this does not pose a configuration control problem. On
the agile team, on the other hand, all team members write and execute tests on an ongoing basis.
Therefore, a small number of large test suites would create a serious practical problem, since two
people would not be able to work on the same test suite in parallel, at least not without requiring
advance work to enable them to merge their work later on. Therefore, there are two methodologies