
Page 100 -
P. 100
TRANSITION TO AGILE SOFTWARE DEVELOPMENT IN A LARGE-SCALE PROJECT 85
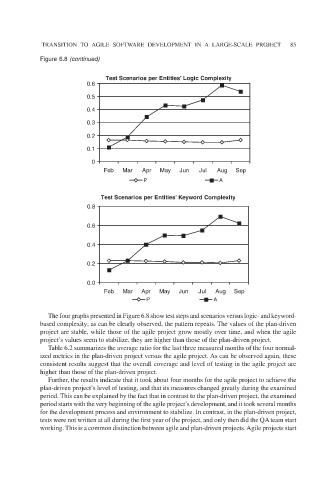
Figure 6.8 (continued)
Test Scenarios per Entities’ Logic Complexity
0.6
0.5
0.4
0.3
0.2
0.1
0
Feb Mar Apr May Jun Jul Aug Sep
P A
Test Scenarios per Entities’ Keyword Complexity
0.8
0.6
0.4
0.2
0.0
Feb Mar Apr May Jun Jul Aug Sep
P A
The four graphs presented in Figure 6.8 show test steps and scenarios versus logic- and keyword-
based complexity; as can be clearly observed, the pattern repeats. The values of the plan-driven
project are stable, while those of the agile project grow mostly over time, and when the agile
project’s values seem to stabilize, they are higher than those of the plan-driven project.
Table 6.2 summarizes the average ratio for the last three measured months of the four normal-
ized metrics in the plan-driven project versus the agile project. As can be observed again, these
consistent results suggest that the overall coverage and level of testing in the agile project are
higher than those of the plan-driven project.
Further, the results indicate that it took about four months for the agile project to achieve the
plan-driven project’s level of testing, and that its measures changed greatly during the examined
period. This can be explained by the fact that in contrast to the plan-driven project, the examined
period starts with the very beginning of the agile project’s development, and it took several months
for the development process and environment to stabilize. In contrast, in the plan-driven project,
tests were not written at all during the first year of the project, and only then did the QA team start
working. This is a common distinction between agile and plan-driven projects. Agile projects start