
Page 123 -
P. 123
90 Part 1 • SyStemS analySiS FundamentalS
Once the systems proposal is written, carefully select who should receive the report.
Personally hand the report to the people you have selected. Your visibility is important for the
acceptance and eventual success of the system.
You can propose a special meeting of key decision makers regarding the systems project for
the purpose of delivering the results of the systems proposal. Develop a separate oral presenta-
tion (illustrated with PowerPoint slides or some other presentation software such as Keynote)
that features highlights of your written report. Keep your presentation brief, from 30-40 minutes
maximum, with the majority of time devoted to questions. Never read your report aloud. It is
preferable to prepare and deliver a dynamic presentation that takes advantage of the fact that you
can interact with key decision makers face to face.
Using Figures for Effective Communication
The emphasis so far in this section has been on considering your audience when composing a
systems proposal. Tables and graphs as well as words are important in capturing and communi-
cating the basics of the proposed system. Never underestimate good design.
Integrating figures into your proposal helps demonstrate that you are responsive to the dif-
ferent ways people absorb information. Figures in the report supplement written information and
must always be interpreted in words; they should never stand alone.
EFFECTIVE USE OF TABLES. Although tables are technically not visual aids, they provide a
different way of grouping and presenting analyzed data that an analyst wants to communicate to
proposal readers.
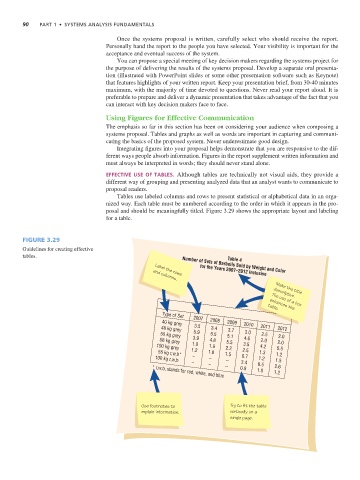
Tables use labeled columns and rows to present statistical or alphabetical data in an orga-
nized way. Each table must be numbered according to the order in which it appears in the pro-
posal and should be meaningfully titled. Figure 3.29 shows the appropriate layout and labeling
for a table.
Figure 3.29
Guidelines for creating effective
tables.
Table 4
Number of Sets of Barbells Sold by Weight and Color
for the Years 2007–2012 Inclusive
Label the rows
and columns.
Make the title
descriptive.
The use of a box
enhances the
table.
Type of Set
2007 2008
40 kg grey 2009 2010
3.5 2011
48 kg grey 3.4 3.7 2012
5.9 3.0
55 kg grey 5.5 5.1 2.5 2.0
3.9 4.6
68 kg grey 4.8 5.5 2.0 2.0
1.0 3.5
100 kg grey 1.9 2.2 4.2 5.5
1.2 2.5
55 kg r,w,b* 1.8 1.5 1.3 1.2
– 0.7
100 kg r,w,b – – 1.2 1.5
– – 3.4 6.5
– 0.8 2.6
1.8
1.2
* r,w,b, stands for red, white, and blue
Use footnotes to Try to fit the table
explain information. vertically on a
single page.