
Page 124 -
P. 124
ChaPter 3 • ProjeCt management 91
The following are some guidelines for tables:
1. Integrate tables into the body of the proposal. Don’t relegate them to the appendices.
2. Try to fit an entire table vertically on a single page, if possible.
3. Number and title a table at the top of the page. Make the title descriptive and meaningful.
4. Label each row and column. Use more than one line for a title, if necessary.
5. Use a boxed table if room permits. Vertically ruled columns will enhance the readability.
6. Use footnotes if necessary to explain detailed information contained in the table.
Several methods for comparing costs and benefits were presented in previous sections.
Tabled results of such comparisons should appear in the systems proposal. If a break-even analy-
sis is done, a table illustrating results of the analysis should be included. Payback can be shown
in tables that serve as additional support for graphs. A short table comparing computer systems
or options might also be included in the systems proposal.
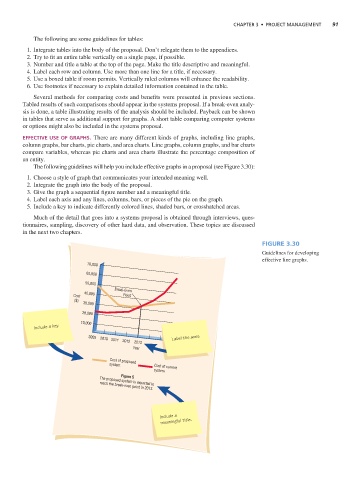
EFFECTIVE USE OF GRAPHS. There are many different kinds of graphs, including line graphs,
column graphs, bar charts, pie charts, and area charts. Line graphs, column graphs, and bar charts
compare variables, whereas pie charts and area charts illustrate the percentage composition of
an entity.
The following guidelines will help you include effective graphs in a proposal (see Figure 3.30):
1. Choose a style of graph that communicates your intended meaning well.
2. Integrate the graph into the body of the proposal.
3. Give the graph a sequential figure number and a meaningful title.
4. Label each axis and any lines, columns, bars, or pieces of the pie on the graph.
5. Include a key to indicate differently colored lines, shaded bars, or crosshatched areas.
Much of the detail that goes into a systems proposal is obtained through interviews, ques-
tionnaires, sampling, discovery of other hard data, and observation. These topics are discussed
in the next two chapters.
Figure 3.30
Guidelines for developing
effective line graphs.
70,000
60,000
50,000
Break-Even
40,000
Cost Point
($)
30,000
20,000
Include a key. 10,000
2009 Label the axes.
2010 2011 2012
2013
Year
Cost of proposed
system
Cost of current
system
Figure 5
The proposed system is expected to
reach the break-even point in 2013.
Include a
meaningful title.