
Page 214 -
P. 214
chaPter 7 • Using Data Flow Diagrams 181
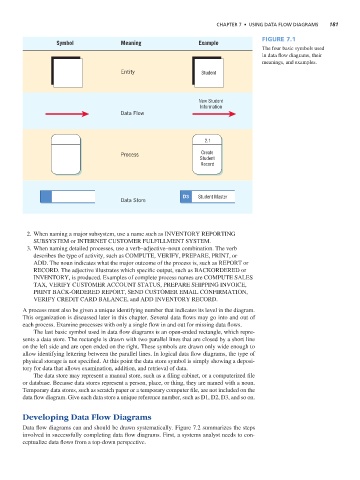
Figure 7.1
Symbol Meaning Example
The four basic symbols used
in data flow diagrams, their
meanings, and examples.
Entity Student
New Student
Information
Data Flow
2.1
Process Create
Student
Record
D3 Student Master
Data Store
2. When naming a major subsystem, use a name such as INVENTORY REPORTING
SUBSYSTEM or INTERNET CUSTOMER FULFILLMENT SYSTEM.
3. When naming detailed processes, use a verb–adjective–noun combination. The verb
describes the type of activity, such as COMPUTE, VERIFY, PREPARE, PRINT, or
ADD. The noun indicates what the major outcome of the process is, such as REPORT or
RECORD. The adjective illustrates which specific output, such as BACKORDERED or
INVENTORY, is produced. Examples of complete process names are COMPUTE SALES
TAX, VERIFY CUSTOMER ACCOUNT STATUS, PREPARE SHIPPING INVOICE,
PRINT BACK-ORDERED REPORT, SEND CUSTOMER EMAIL CONFIRMATION,
VERIFY CREDIT CARD BALANCE, and ADD INVENTORY RECORD.
A process must also be given a unique identifying number that indicates its level in the diagram.
This organization is discussed later in this chapter. Several data flows may go into and out of
each process. Examine processes with only a single flow in and out for missing data flows.
The last basic symbol used in data flow diagrams is an open-ended rectangle, which repre-
sents a data store. The rectangle is drawn with two parallel lines that are closed by a short line
on the left side and are open ended on the right. These symbols are drawn only wide enough to
allow identifying lettering between the parallel lines. In logical data flow diagrams, the type of
physical storage is not specified. At this point the data store symbol is simply showing a deposi-
tory for data that allows examination, addition, and retrieval of data.
The data store may represent a manual store, such as a filing cabinet, or a computerized file
or database. Because data stores represent a person, place, or thing, they are named with a noun.
Temporary data stores, such as scratch paper or a temporary computer file, are not included on the
data flow diagram. Give each data store a unique reference number, such as D1, D2, D3, and so on.
Developing Data Flow Diagrams
Data flow diagrams can and should be drawn systematically. Figure 7.2 summarizes the steps
involved in successfully completing data flow diagrams. First, a systems analyst needs to con-
ceptualize data flows from a top-down perspective.