
Page 215 -
P. 215
182 Part 3 • the analysis Process
Figure 7.2
Steps in developing data flow
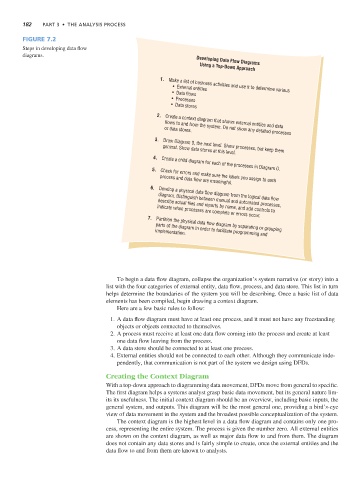
diagrams. Developing Data Flow Diagrams
Using a Top-Down Approach
• External entities
1. Make a list of business activities and use it to determine various
• Data flows
• Processes
• Data stores
2. Create a context diagram that shows external entities and data
or data stores.
flows to and from the system. Do not show any detailed processes
3. Draw Diagram 0, the next level. Show processes, but keep them
general. Show data stores at this level.
4. Create a child diagram for each of the processes in Diagram 0.
5. Check for errors and make sure the labels you assign to each
process and data flow are meaningful.
6. Develop a physical data flow diagram from the logical data flow
diagram. Distinguish between manual and automated processes,
describe actual files and reports by name, and add controls to
indicate when processes are complete or errors occur.
7. Partition the physical data flow diagram by separating or grouping
implementation.
parts of the diagram in order to facilitate programming and
To begin a data flow diagram, collapse the organization’s system narrative (or story) into a
list with the four categories of external entity, data flow, process, and data store. This list in turn
helps determine the boundaries of the system you will be describing. Once a basic list of data
elements has been compiled, begin drawing a context diagram.
Here are a few basic rules to follow:
1. A data flow diagram must have at least one process, and it must not have any freestanding
objects or objects connected to themselves.
2. A process must receive at least one data flow coming into the process and create at least
one data flow leaving from the process.
3. A data store should be connected to at least one process.
4. External entities should not be connected to each other. Although they communicate inde-
pendently, that communication is not part of the system we design using DFDs.
Creating the Context Diagram
With a top-down approach to diagramming data movement, DFDs move from general to specific.
The first diagram helps a systems analyst grasp basic data movement, but its general nature lim-
its its usefulness. The initial context diagram should be an overview, including basic inputs, the
general system, and outputs. This diagram will be the most general one, providing a bird’s-eye
view of data movement in the system and the broadest possible conceptualization of the system.
The context diagram is the highest level in a data flow diagram and contains only one pro-
cess, representing the entire system. The process is given the number zero. All external entities
are shown on the context diagram, as well as major data flow to and from them. The diagram
does not contain any data stores and is fairly simple to create, once the external entities and the
data flow to and from them are known to analysts.