
Page 220 -
P. 220
chaPter 7 • Using Data Flow Diagrams 187
Employee
Hours
Worked
1
Number of Withholding
Create Employee Dependents Rates Withholding
Employee D1 Master D4 Tables
Time
Record
Employee
Record
Employee
Time Record
2 3
Employee
D2 Employee Time Record Calculate Gross Pay Calculate D3 Check
Time File Gross Withholding Reconciliation
Pay Amount
Check
Withholding Reconciliation
Amount Record
Withholding
4 6
Amount
Gross Pay Calculate Create
Net Check
Pay Reconciliation
File
Net
Pay
Gross Pay Paycheck Information
5
Employee Employee
Employee Record Print Paycheck
D1
Master Employee
Check Employee
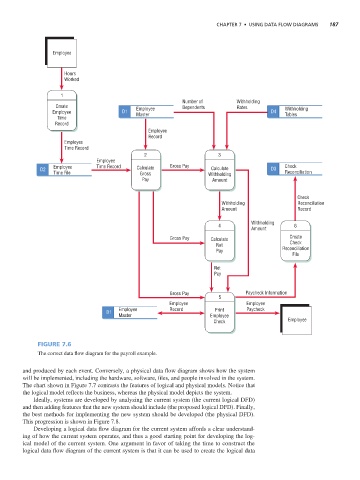
Figure 7.6
The correct data flow diagram for the payroll example.
and produced by each event. Conversely, a physical data flow diagram shows how the system
will be implemented, including the hardware, software, files, and people involved in the system.
The chart shown in Figure 7.7 contrasts the features of logical and physical models. Notice that
the logical model reflects the business, whereas the physical model depicts the system.
Ideally, systems are developed by analyzing the current system (the current logical DFD)
and then adding features that the new system should include (the proposed logical DFD). Finally,
the best methods for implementing the new system should be developed (the physical DFD).
This progression is shown in Figure 7.8.
Developing a logical data flow diagram for the current system affords a clear understand-
ing of how the current system operates, and thus a good starting point for developing the log-
ical model of the current system. One argument in favor of taking the time to construct the
logical data flow diagram of the current system is that it can be used to create the logical data