
Page 221 -
P. 221
188 Part 3 • the analysis Process
Figure 7.7
Design Feature Logical Physical
Features common to both logical
and physical data flow diagrams. What the model How the business How the system will be implemented (or
depicts operates. how the current system operates).
What the processes Business activities. Programs, program modules, and
represent manual procedures.
What the data stores Collections of data Physical files and databases, manual
represent regardless of how files.
the data are stored.
Type of data stores Show data stores Master files, transition files. Any processes
representing that operate at two different times must
permanent data be connected by a data store.
collections.
System controls Show business Show controls for validating input data, for
controls. obtaining a record (record found status),
for ensuring successful completion of a
process, and for system security (example:
journal records).
flow diagram of the new system. Processes that will be unnecessary in the new system may be
dropped, and new features, activities, output, input, and stored data may be added. This approach
provides a means of ensuring that the essential features of the old system are retained in the new
system. In addition, using the logical model for the current system as a basis for the proposed
system provides for a gradual transition to the design of the new system. After the logical model
for the new system has been developed, it may be used to create a physical data flow diagram for
the new system.
Figure 7.9 shows a logical data flow diagram and a physical data flow diagram for a grocery
store cashier. The CUSTOMER brings the ITEMS to the register; PRICES for all ITEMS are
LOOKED UP and then totaled; next, PAYMENT is given to the cashier; finally, the CUSTOMER
is given a RECEIPT. The logical data flow diagram illustrates the processes involved without
going into detail about the physical implementation of activities. The physical data flow diagram
shows that a bar code—the universal product code (UPC) BAR CODE found on most grocery
store items—is used. In addition, the physical data flow diagram mentions manual processes
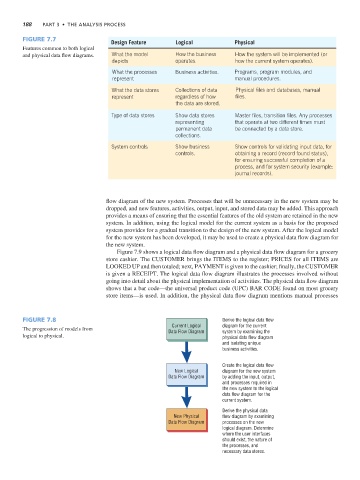
Figure 7.8 Derive the logical data flow
Current Logical diagram for the current
The progression of models from Data Flow Diagram system by examining the
logical to physical. physical data flow diagram
and isolating unique
business activities.
Create the logical data flow
New Logical diagram for the new system
Data Flow Diagram by adding the input, output,
and processes required in
the new system to the logical
data flow diagram for the
current system.
Derive the physical data
New Physical flow diagram by examining
Data Flow Diagram processes on the new
logical diagram. Determine
where the user interfaces
should exist, the nature of
the processes, and
necessary data stores.