
Page 228 -
P. 228
chaPter 7 • Using Data Flow Diagrams 195
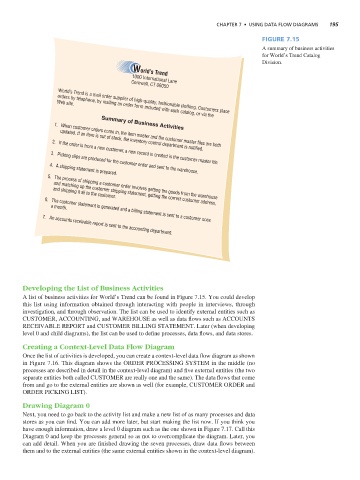
Figure 7.15
A summary of business activities
for World’s Trend Catalog
Division.
World’s Trend
1000 International Lane
Cornwall, CT 06050
Web site.
World’s Trend is a mail order supplier of high-quality, fashionable clothing. Customers place
orders by telephone, by mailing an order form included with each catalog, or via the
Summary of Business Activities
2. 1. When customer orders come in, the item master and the customer master files are both
updated. If an item is out of stock, the inventory control department is notified.
3. If the order is from a new customer, a new record is created in the customer master file.
4. A shipping statement is prepared.
Picking slips are produced for the customer order and sent to the warehouse.
5. The process of shipping a customer order involves getting the goods from the warehouse
6. and shipping it all to the customer.
and matching up the customer shipping statement, getting the correct customer address,
a month.
7. An accounts receivable report is sent to the accounting department.
The customer statement is generated and a billing statement is sent to a customer once
Developing the List of Business Activities
A list of business activities for World’s Trend can be found in Figure 7.15. You could develop
this list using information obtained through interacting with people in interviews, through
investigation, and through observation. The list can be used to identify external entities such as
CUSTOMER, ACCOUNTING, and WAREHOUSE as well as data flows such as ACCOUNTS
RECEIVABLE REPORT and CUSTOMER BILLING STATEMENT. Later (when developing
level 0 and child diagrams), the list can be used to define processes, data flows, and data stores.
Creating a Context-Level Data Flow Diagram
Once the list of activities is developed, you can create a context-level data flow diagram as shown
in Figure 7.16. This diagram shows the ORDER PROCESSING SYSTEM in the middle (no
processes are described in detail in the context-level diagram) and five external entities (the two
separate entities both called CUSTOMER are really one and the same). The data flows that come
from and go to the external entities are shown as well (for example, CUSTOMER ORDER and
ORDER PICKING LIST).
Drawing Diagram 0
Next, you need to go back to the activity list and make a new list of as many processes and data
stores as you can find. You can add more later, but start making the list now. If you think you
have enough information, draw a level 0 diagram such as the one shown in Figure 7.17. Call this
Diagram 0 and keep the processes general so as not to overcomplicate the diagram. Later, you
can add detail. When you are finished drawing the seven processes, draw data flows between
them and to the external entities (the same external entities shown in the context-level diagram).