
Page 231 -
P. 231
198 Part 3 • the analysis Process
Customer Not
Found Error
1.1
Customer
Order Validate Valid Customer Information
Customer Valid Customer Information
Account
Customer
Order
Customer
Record
1.6 1.7
Pending
Customer Customer Record Update Create Order
D1 Master Customer Order Order Pending
Record Totals Totals Order
Shipping and Shipping Costs
D4 Handling Table
1.5
Item Price
Item and Weight Calculate
D2 Master Order Available
Totals Item
Available
Item
1.2 Item Quantity on Hand 1.3 1.4
Customer
Order Validate Valid Item Determine Update
Order Quantity Item
Item Available Available Item Quantity
Item Not Back-Ordered Item
Found Error Item Record
D2 Item
Master
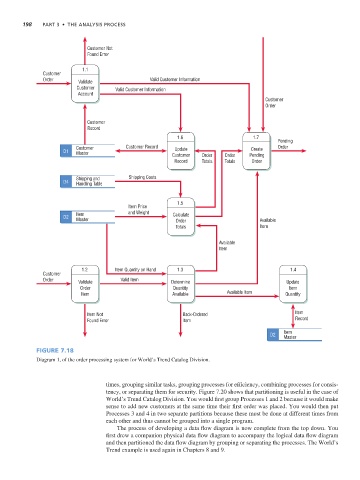
Figure 7.18
Diagram 1, of the order processing system for World’s Trend Catalog Division.
times, grouping similar tasks, grouping processes for efficiency, combining processes for consis-
tency, or separating them for security. Figure 7.20 shows that partitioning is useful in the case of
World’s Trend Catalog Division. You would first group Processes 1 and 2 because it would make
sense to add new customers at the same time their first order was placed. You would then put
Processes 3 and 4 in two separate partitions because these must be done at different times from
each other and thus cannot be grouped into a single program.
The process of developing a data flow diagram is now complete from the top down. You
first drew a companion physical data flow diagram to accompany the logical data flow diagram
and then partitioned the data flow diagram by grouping or separating the processes. The World’s
Trend example is used again in Chapters 8 and 9.