
Page 295 -
P. 295
262 Part 3 • the analysis Process
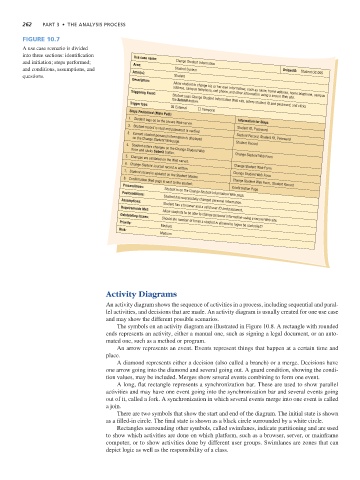
Figure 10.7
A use case scenario is divided
into three sections: identification
Use case name:
and initiation; steps performed; Area: Change Student Information
and conditions, assumptions, and Actor(s): Student System UniqueID: Student UC 005
questions. Student
Description:
Triggering Event: address, campus telephone, cell phone, and other information using a secure Web site.
Allow student to change his or her own information, such as name, home address, home telephone, campus
the Submit button.
Trigger type:
Student uses Change Student Information Web site, enters student ID and password, and clicks
External
Temporal
Steps Performed (Main Path)
Information for Steps
1. Student logs on to the secure Web server.
Student ID, Password
2. Student record is read and password is verified.
3. Current student personal information is displayed Student Record, Student ID, Password
on the Change Student Web page.
Student Record
4. Student enters changes on the Change Student Web
form and clicks Submit button.
Change Student Web Form
5. Changes are validated on the Web server.
Change Student Web Form
6. Change Student Journal record is written.
Change Student Web Form
7. Student record is updated on the Student Master.
8. Confirmation Web page is sent to the student.
Preconditions: Change Student Web Form, Student Record
Confirmation Page
Postconditions: Student is on the Change Student Information Web page.
Assumptions: Student has successfully changed personal information.
Requirements Met: Student has a browser and a valid user ID and password.
Outstanding Issues: Allow students to be able to change personal information using a secure Web site.
Priority: Should the number of times a student is allowed to logon be controlled?
Medium
Risk:
Medium
Activity Diagrams
An activity diagram shows the sequence of activities in a process, including sequential and paral-
lel activities, and decisions that are made. An activity diagram is usually created for one use case
and may show the different possible scenarios.
The symbols on an activity diagram are illustrated in Figure 10.8. A rectangle with rounded
ends represents an activity, either a manual one, such as signing a legal document, or an auto-
mated one, such as a method or program.
An arrow represents an event. Events represent things that happen at a certain time and
place.
A diamond represents either a decision (also called a branch) or a merge. Decisions have
one arrow going into the diamond and several going out. A guard condition, showing the condi-
tion values, may be included. Merges show several events combining to form one event.
A long, flat rectangle represents a synchronization bar. These are used to show parallel
activities and may have one event going into the synchronization bar and several events going
out of it, called a fork. A synchronization in which several events merge into one event is called
a join.
There are two symbols that show the start and end of the diagram. The initial state is shown
as a filled-in circle. The final state is shown as a black circle surrounded by a white circle.
Rectangles surrounding other symbols, called swimlanes, indicate partitioning and are used
to show which activities are done on which platform, such as a browser, server, or mainframe
computer, or to show activities done by different user groups. Swimlanes are zones that can
depict logic as well as the responsibility of a class.