
Page 297 -
P. 297
264 Part 3 • the analysis Process
Client Web Page Web Server Mainframe
Form Transmitted Receive Web User ID and Password Get Student
Logon System
Form Record
Record
Status
Send Error Message Display Error Not Found
Message
Web Form Sent Display Current Exchange Data Placed in Message Queue
Student Data
Web Form Received
Enter Changes Validate Changes
Validation Status
Valid Data Received
Invalid Data Received
Valid Data Valid Data
Send Error Messages Display Update Student Create Change
Error Message Record Student Journal
Record
Cancel Record Record
Updated Written
Cancel Confirmation Sent Display Valid Update
Confirmation
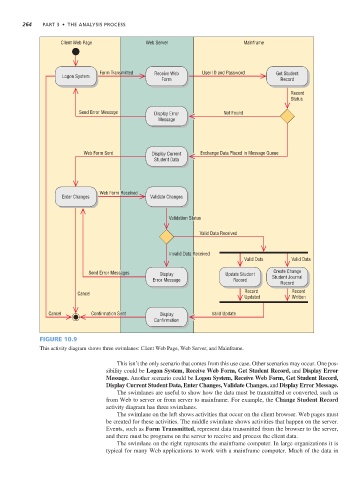
Figure 10.9
This activity diagram shows three swimlanes: Client Web Page, Web Server, and Mainframe.
This isn’t the only scenario that comes from this use case. Other scenarios may occur. One pos-
sibility could be Logon System, Receive Web Form, Get Student Record, and Display Error
Message. Another scenario could be Logon System, Receive Web Form, Get Student Record,
Display Current Student Data, Enter Changes, Validate Changes, and Display Error Message.
The swimlanes are useful to show how the data must be transmitted or converted, such as
from Web to server or from server to mainframe. For example, the Change Student Record
activity diagram has three swimlanes.
The swimlane on the left shows activities that occur on the client browser. Web pages must
be created for these activities. The middle swimlane shows activities that happen on the server.
Events, such as Form Transmitted, represent data transmitted from the browser to the server,
and there must be programs on the server to receive and process the client data.
The swimlane on the right represents the mainframe computer. In large organizations it is
typical for many Web applications to work with a mainframe computer. Much of the data in