
Page 161 - Tandem Techniques
P. 161
Page 144
provide adequate data will depend strongly on the extinction coefficient of the solute at the critical
adsorption wavelengths of the respective compounds.
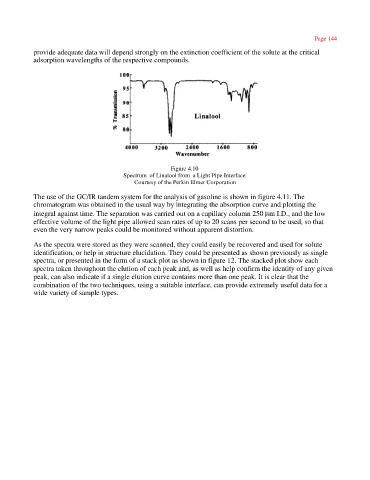
Figure 4.10
Spectrum of Linalool from a Light Pipe Interface
Courtesy of the Perkin Elmer Corporation
The use of the GC/IR tandem system for the analysis of gasoline is shown in figure 4.11. The
chromatogram was obtained in the usual way by integrating the absorption curve and plotting the
integral against time. The separation was carried out on a capillary column 250 mm I.D., and the low
effective volume of the light pipe allowed scan rates of up to 20 scans per second to be used, so that
even the very narrow peaks could be monitored without apparent distortion.
As the spectra were stored as they were scanned, they could easily be recovered and used for solute
identification, or help in structure elucidation. They could be presented as shown previously as single
spectra, or presented in the form of a stack plot as shown in figure 12. The stacked plot show each
spectra taken throughout the elution of each peak and, as well as help confirm the identity of any given
peak, can also indicate if a single elution curve contains more than one peak. It is clear that the
combination of the two techniques, using a suitable interface, can provide extremely useful data for a
wide variety of sample types.