
Page 162 - Tandem Techniques
P. 162
Page 145
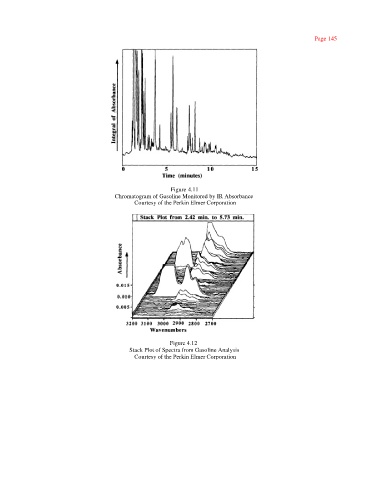
Figure 4.11
Chromatogram of Gasoline Monitored by IR Absorbance
Courtesy of the Perkin Elmer Corporation
Figure 4.12
Stack Plot of Spectra from Gasoline Analysis
Courtesy of the Perkin Elmer Corporation