
Page 186 - Bruce Ellig - The Complete Guide to Executive Compensation (2007)
P. 186
172 The Complete Guide to Executive Compensation
$ $
Job Value
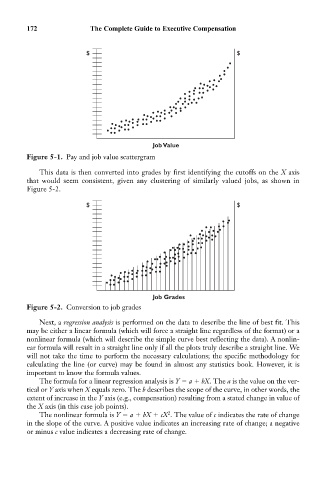
Figure 5-1. Pay and job value scattergram
This data is then converted into grades by first identifying the cutoffs on the X axis
that would seem consistent, given any clustering of similarly valued jobs, as shown in
Figure 5-2.
$ $
Job Grades
Figure 5-2. Conversion to job grades
Next, a regression analysis is performed on the data to describe the line of best fit. This
may be either a linear formula (which will force a straight line regardless of the format) or a
nonlinear formula (which will describe the simple curve best reflecting the data). A nonlin-
ear formula will result in a straight line only if all the plots truly describe a straight line. We
will not take the time to perform the necessary calculations; the specific methodology for
calculating the line (or curve) may be found in almost any statistics book. However, it is
important to know the formula values.
The formula for a linear regression analysis is Y a bX. The a is the value on the ver-
tical or Y axis when X equals zero. The b describes the scope of the curve, in other words, the
extent of increase in the Y axis (e.g., compensation) resulting from a stated change in value of
the X axis (in this case job points).
The nonlinear formula is Y a bX cX . The value of c indicates the rate of change
2
in the slope of the curve. A positive value indicates an increasing rate of change; a negative
or minus c value indicates a decreasing rate of change.