
Page 190 - Bruce Ellig - The Complete Guide to Executive Compensation (2007)
P. 190
176 The Complete Guide to Executive Compensation
$
B
C
A
Job Grades
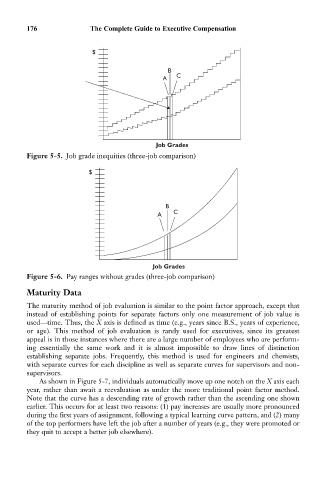
Figure 5-5. Job grade inequities (three-job comparison)
$
B
C
A
Job Grades
Figure 5-6. Pay ranges without grades (three-job comparison)
Maturity Data
The maturity method of job evaluation is similar to the point factor approach, except that
instead of establishing points for separate factors only one measurement of job value is
used—time. Thus, the X axis is defined as time (e.g., years since B.S., years of experience,
or age). This method of job evaluation is rarely used for executives, since its greatest
appeal is in those instances where there are a large number of employees who are perform-
ing essentially the same work and it is almost impossible to draw lines of distinction
establishing separate jobs. Frequently, this method is used for engineers and chemists,
with separate curves for each discipline as well as separate curves for supervisors and non-
supervisors.
As shown in Figure 5-7, individuals automatically move up one notch on the X axis each
year, rather than await a reevaluation as under the more traditional point factor method.
Note that the curve has a descending rate of growth rather than the ascending one shown
earlier. This occurs for at least two reasons: (1) pay increases are usually more pronounced
during the first years of assignment, following a typical learning curve pattern, and (2) many
of the top performers have left the job after a number of years (e.g., they were promoted or
they quit to accept a better job elsewhere).