
Page 188 - Bruce Ellig - The Complete Guide to Executive Compensation (2007)
P. 188
174 The Complete Guide to Executive Compensation
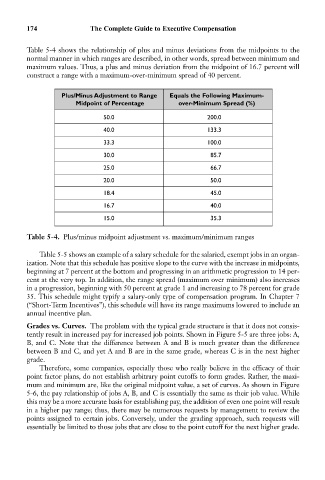
Table 5-4 shows the relationship of plus and minus deviations from the midpoints to the
normal manner in which ranges are described, in other words, spread between minimum and
maximum values. Thus, a plus and minus deviation from the midpoint of 16.7 percent will
construct a range with a maximum-over-minimum spread of 40 percent.
Plus/Minus Adjustment to Range Equals the Following Maximum-
Midpoint of Percentage over-Minimum Spread (%)
50.0 200.0
40.0 133.3
33.3 100.0
30.0 85.7
25.0 66.7
20.0 50.0
18.4 45.0
16.7 40.0
15.0 35.3
Table 5-4. Plus/minus midpoint adjustment vs. maximum/minimum ranges
Table 5-5 shows an example of a salary schedule for the salaried, exempt jobs in an organ-
ization. Note that this schedule has positive slope to the curve with the increase in midpoints,
beginning at 7 percent at the bottom and progressing in an arithmetic progression to 14 per-
cent at the very top. In addition, the range spread (maximum over minimum) also increases
in a progression, beginning with 50 percent at grade 1 and increasing to 78 percent for grade
35. This schedule might typify a salary-only type of compensation program. In Chapter 7
(“Short-Term Incentives”), this schedule will have its range maximums lowered to include an
annual incentive plan.
Grades vs. Curves. The problem with the typical grade structure is that it does not consis-
tently result in increased pay for increased job points. Shown in Figure 5-5 are three jobs: A,
B, and C. Note that the difference between A and B is much greater than the difference
between B and C, and yet A and B are in the same grade, whereas C is in the next higher
grade.
Therefore, some companies, especially those who really believe in the efficacy of their
point factor plans, do not establish arbitrary point cutoffs to form grades. Rather, the maxi-
mum and minimum are, like the original midpoint value, a set of curves. As shown in Figure
5-6, the pay relationship of jobs A, B, and C is essentially the same as their job value. While
this may be a more accurate basis for establishing pay, the addition of even one point will result
in a higher pay range; thus, there may be numerous requests by management to review the
points assigned to certain jobs. Conversely, under the grading approach, such requests will
essentially be limited to those jobs that are close to the point cutoff for the next higher grade.