
Page 187 - Bruce Ellig - The Complete Guide to Executive Compensation (2007)
P. 187
Chapter 5. Salary 173
The difference between the plot points and the curve is measured vertically and is iden-
tified as the deviation. The line of best fit will, by definition, minimize the degree of devia-
tions existing. The sum of the squares of these deviations will not only be equal above and
below the line, but also will be the lowest possible value. This is called the least squares method.
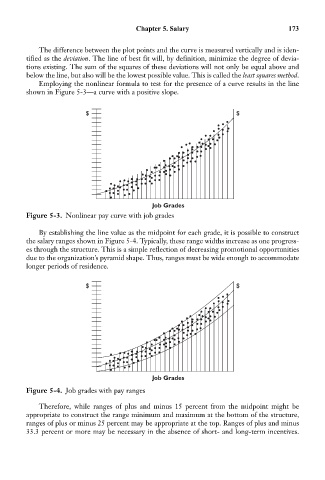
Employing the nonlinear formula to test for the presence of a curve results in the line
shown in Figure 5-3—a curve with a positive slope.
$ $
Job Grades
Figure 5-3. Nonlinear pay curve with job grades
By establishing the line value as the midpoint for each grade, it is possible to construct
the salary ranges shown in Figure 5-4. Typically, these range widths increase as one progress-
es through the structure. This is a simple reflection of decreasing promotional opportunities
due to the organization’s pyramid shape. Thus, ranges must be wide enough to accommodate
longer periods of residence.
$ $
Job Grades
Figure 5-4. Job grades with pay ranges
Therefore, while ranges of plus and minus 15 percent from the midpoint might be
appropriate to construct the range minimum and maximum at the bottom of the structure,
ranges of plus or minus 25 percent may be appropriate at the top. Ranges of plus and minus
33.3 percent or more may be necessary in the absence of short- and long-term incentives.