
Page 234 - Bruce Ellig - The Complete Guide to Executive Compensation (2007)
P. 234
220 The Complete Guide to Executive Compensation
Performance Rating
Range Range
Year Maximum 0 1 2 3 4 5 6 Maximum
0 0.80 0.80 0.80 0.80 0.80 0.80 0.80 0.80 1.20
1 0.80 0.75 0.80 0.82 0.84 0.86 0.88 0.91 1.20
2 0.80 0.71 0.80 0.83 0.83 0.90 0.94 1.00 1.20
3 0.80 0.67 0.80 0.85 0.90 0.94 1.00 1.07 1.20
4 0.80 0.63 0.80 0.86 0.93 0.99 1.05 1.14 1.20
5 0.80 0.60 0.80 0.86 0.95 1.03 1.10 1.19 1.20
6 0.80 0.56 0.80 0.86 0.98 1.06 1.15 1.20 1.20
7 0.80 0.53 0.80 0.86 1.01 1.09 1.19 1.20 1.20
8 0.80 0.50 0.80 0.86 1.02 1.13 1.20 1.20 1.20
9 0.80 0.47 0.80 0.86 1.03 1.16 1.20 1.20 1.20
10 0.80 0.45 0.80 0.86 1.04 1.17 1.20 1.20 1.20
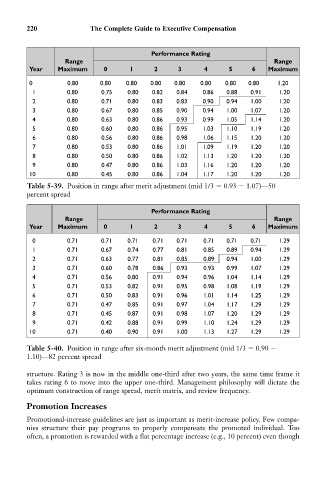
Table 5-39. Position in range after merit adjustment (mid 1/3 0.93 1.07)—50
percent spread
Performance Rating
Range Range
Year Maximum 0 1 2 3 4 5 6 Maximum
0 0.71 0.71 0.71 0.71 0.71 0.71 0.71 0.71 1.29
1 0.71 0.67 0.74 0.77 0.81 0.85 0.89 0.94 1.29
2 0.71 0.63 0.77 0.81 0.85 0.89 0.94 1.00 1.29
3 0.71 0.60 0.78 0.86 0.93 0.93 0.99 1.07 1.29
4 0.71 0.56 0.80 0.91 0.94 0.96 1.04 1.14 1.29
5 0.71 0.53 0.82 0.91 0.95 0.98 1.08 1.19 1.29
6 0.71 0.50 0.83 0.91 0.96 1.01 1.14 1.25 1.29
7 0.71 0.47 0.85 0.91 0.97 1.04 1.17 1.29 1.29
8 0.71 0.45 0.87 0.91 0.98 1.07 1.20 1.29 1.29
9 0.71 0.42 0.88 0.91 0.99 1.10 1.24 1.29 1.29
10 0.71 0.40 0.90 0.91 1.00 1.13 1.27 1.29 1.29
Table 5-40. Position in range after six-month merit adjustment (mid 1/3 0.90
1.10)—82 percent spread
structure. Rating 3 is now in the middle one-third after two years, the same time frame it
takes rating 6 to move into the upper one-third. Management philosophy will dictate the
optimum construction of range spread, merit matrix, and review frequency.
Promotion Increases
Promotional-increase guidelines are just as important as merit-increase policy. Few compa-
nies structure their pay programs to properly compensate the promoted individual. Too
often, a promotion is rewarded with a flat percentage increase (e.g., 10 percent) even though