
Page 233 - Bruce Ellig - The Complete Guide to Executive Compensation (2007)
P. 233
Chapter 5. Salary 219
Performance Rating
Range Range
Year Maximum 0 1 2 3 4 5 6 Maximum
0 0.71 0.71 0.71 0.71 0.71 0.71 0.71 0.71 1.29
1 0.71 0.67 0.71 0.72 0.74 0.76 0.78 0.81 1.29
2 0.71 0.63 0.71 0.74 0.78 0.80 0.84 0.89 1.29
3 0.71 0.60 0.71 0.75 0.80 0.84 0.89 0.97 1.29
4 0.71 0.56 0.71 0.76 0.82 0.88 0.95 1.03 1.29
5 0.71 0.53 0.71 0.76 0.85 0.92 0.99 1.10 1.29
6 0.71 0.50 0.71 0.76 0.87 0.96 1.04 1.15 1.29
7 0.71 0.47 0.71 0.76 0.90 0.99 1.09 1.21 1.29
8 0.71 0.45 0.71 0.76 0.92 1.02 1.14 1.27 1.29
9 0.71 0.42 0.71 0.76 0.95 1.05 1.17 1.29 1.29
10 0.71 0.40 0.71 0.76 0.96 1.08 1.21 1.29 1.29
Performance Below Lower Middle Upper Above
Rating Minimum 1/3 1/3 1/3 Maximum
6 21% 16% 13% 1% 0
5 17 13 11 9 0
4 14 11 9 7 0
3 11 9 7 5 0
2 8 6 5 4 0
1 6 4 3 2 0
0 0 0 0 0
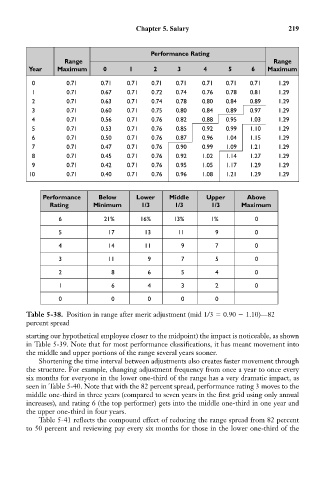
Table 5-38. Position in range after merit adjustment (mid 1/3 0.90 1.10)—82
percent spread
starting our hypothetical employee closer to the midpoint) the impact is noticeable, as shown
in Table 5-39. Note that for most performance classifications, it has meant movement into
the middle and upper portions of the range several years sooner.
Shortening the time interval between adjustments also creates faster movement through
the structure. For example, changing adjustment frequency from once a year to once every
six months for everyone in the lower one-third of the range has a very dramatic impact, as
seen in Table 5-40. Note that with the 82 percent spread, performance rating 3 moves to the
middle one-third in three years (compared to seven years in the first grid using only annual
increases), and rating 6 (the top performer) gets into the middle one-third in one year and
the upper one-third in four years.
Table 5-41 reflects the compound effect of reducing the range spread from 82 percent
to 50 percent and reviewing pay every six months for those in the lower one-third of the