Page 230 - Bruce Ellig - The Complete Guide to Executive Compensation (2007)
P. 230

216               The Complete Guide to Executive Compensation
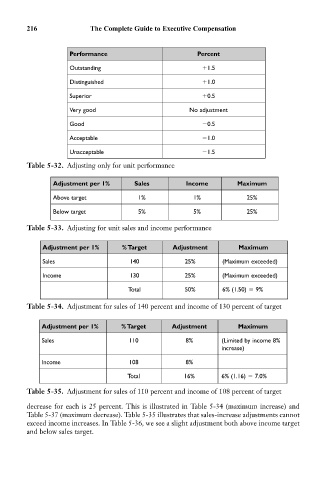

                        Performance                         Percent

                        Outstanding                            1.5
                        Distinguished                          1.0

                        Superior                               0.5
                        Very good                         No adjustment

                        Good                                   0.5
                        Acceptable                             1.0

                        Unacceptable                           1.5
            Table 5-32. Adjusting only for unit performance


                   Adjustment per 1%      Sales          Income         Maximum
                   Above target            1%              1%              25%
                   Below target            5%              5%              25%

            Table 5-33. Adjusting for unit sales and income performance


                Adjustment per 1%      % Target      Adjustment         Maximum
                Sales                    140             25%        (Maximum exceeded)

                Income                   130             25%        (Maximum exceeded)
                                         Total           50%        6% (1.50)   9%

            Table 5-34. Adjustment for sales of 140 percent and income of 130 percent of target


                Adjustment per 1%      % Target      Adjustment         Maximum
                Sales                    110             8%        (Limited by income 8%
                                                                   increase)
                Income                   108             8%

                                        Total            16%       6% (1.16)   7.0%
            Table 5-35. Adjustment for sales of 110 percent and income of 108 percent of target

            decrease for each is 25 percent. This is illustrated in Table 5-34 (maximum increase) and
            Table 5-37 (maximum decrease). Table 5-35 illustrates that sales-increase adjustments cannot
            exceed income increases. In Table 5-36, we see a slight adjustment both above income target
            and below sales target.
   225   226   227   228   229   230   231   232   233   234   235