
Page 227 - Bruce Ellig - The Complete Guide to Executive Compensation (2007)
P. 227
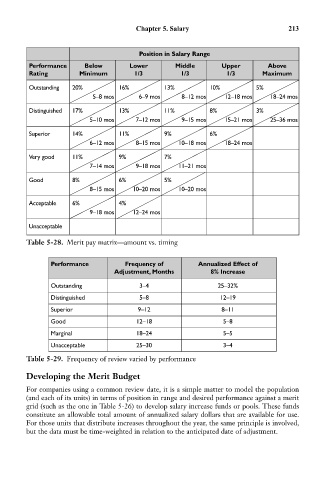
Chapter 5. Salary                           213


                                           Position in Salary Range
            Performance     Below        Lower        Middle       Upper        Above
            Rating        Minimum         1/3          1/3          1/3       Maximum
            Outstanding  20%         16%          13%          10%           5%
                              5–8 mos      6–9 mos     8–12 mos     12–18 mos    18–24 mos
            Distinguished  17%       13%          11%          8%            3%
                             5–10 mos     7–12 mos     9–15 mos     15–21 mos    25–36 mos
            Superior    14%          11%          9%           6%
                             6–12 mos     8–15 mos     10–18 mos    18–24 mos

            Very good   11%          9%           7%
                             7–14 mos     9–18 mos     11–21 mos

            Good        8%           6%           5%
                             8–15 mos    10–20 mos     10–20 mos

            Acceptable  6%           4%
                             9–18 mos    12–24 mos

            Unacceptable

           Table 5-28. Merit pay matrix—amount vs. timing


                  Performance          Frequency of         Annualized Effect of
                                    Adjustment, Months          8% Increase

                  Outstanding              3–4                    25–32%
                  Distinguished            5–8                    12–19
                  Superior                 9–12                    8–11
                  Good                    12–18                    5–8
                  Marginal                18–24                    5–5
                  Unacceptable            25–30                    3–4

           Table 5-29. Frequency of review varied by performance

           Developing the Merit Budget
           For companies using a common review date, it is a simple matter to model the population
           (and each of its units) in terms of position in range and desired performance against a merit
           grid (such as the one in Table 5-26) to develop salary increase funds or pools. These funds
           constitute an allowable total amount of annualized salary dollars that are available for use.
           For those units that distribute increases throughout the year, the same principle is involved,
           but the data must be time-weighted in relation to the anticipated date of adjustment.