
Page 224 - Bruce Ellig - The Complete Guide to Executive Compensation (2007)
P. 224
210 The Complete Guide to Executive Compensation
Job
Grades
0 1 2 3 4 5 6
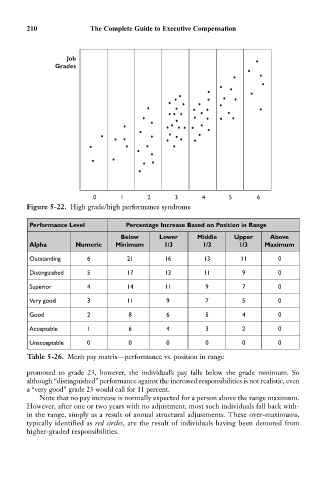
Figure 5-22. High grade/high performance syndrome
Performance Level Percentage Increase Based on Position in Range
Below Lower Middle Upper Above
Alpha Numeric Minimum 1/3 1/3 1/3 Maximum
Outstanding 6 21 16 13 11 0
Distinguished 5 17 13 11 9 0
Superior 4 14 11 9 7 0
Very good 3 11 9 7 5 0
Good 2 8 6 5 4 0
Acceptable 1 6 4 3 2 0
Unacceptable 0 0 0 0 0 0
Table 5-26. Merit pay matrix—performance vs. position in range
promoted to grade 23, however, the individual’s pay falls below the grade minimum. So
although “distinguished” performance against the increased responsibilities is not realistic, even
a “very good” grade 23 would call for 11 percent.
Note that no pay increase is normally expected for a person above the range maximum.
However, after one or two years with no adjustment, most such individuals fall back with-
in the range, simply as a result of annual structural adjustments. These over-maximums,
typically identified as red circles, are the result of individuals having been demoted from
higher-graded responsibilities.