
Page 223 - Bruce Ellig - The Complete Guide to Executive Compensation (2007)
P. 223
Chapter 5. Salary 209
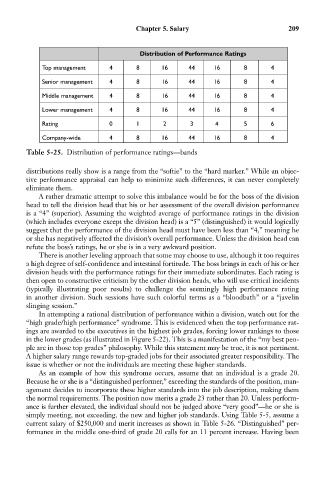
Distribution of Performance Ratings
Top management 4 8 16 44 16 8 4
Senior management 4 8 16 44 16 8 4
Middle management 4 8 16 44 16 8 4
Lower management 4 8 16 44 16 8 4
Rating 0 1 2 3 4 5 6
Company-wide 4 8 16 44 16 8 4
Table 5-25. Distribution of performance ratings—bands
distributions really show is a range from the “softie” to the “hard marker.” While an objec-
tive performance appraisal can help to minimize such differences, it can never completely
eliminate them.
A rather dramatic attempt to solve this imbalance would be for the boss of the division
head to tell the division head that his or her assessment of the overall division performance
is a “4” (superior). Assuming the weighted average of performance ratings in the division
(which includes everyone except the division head) is a “5” (distinguished) it would logically
suggest that the performance of the division head must have been less than “4,” meaning he
or she has negatively affected the division’s overall performance. Unless the division head can
refute the boss’s ratings, he or she is in a very awkward position.
There is another leveling approach that some may choose to use, although it too requires
a high degree of self-confidence and intestinal fortitude. The boss brings in each of his or her
division heads with the performance ratings for their immediate subordinates. Each rating is
then open to constructive criticism by the other division heads, who will use critical incidents
(typically illustrating poor results) to challenge the seemingly high performance rating
in another division. Such sessions have such colorful terms as a “bloodbath” or a “javelin
slinging session.”
In attempting a rational distribution of performance within a division, watch out for the
“high grade/high performance” syndrome. This is evidenced when the top performance rat-
ings are awarded to the executives in the highest job grades, forcing lower rankings to those
in the lower grades (as illustrated in Figure 5-22). This is a manifestation of the “my best peo-
ple are in those top grades” philosophy. While this statement may be true, it is not pertinent.
A higher salary range rewards top-graded jobs for their associated greater responsibility. The
issue is whether or not the individuals are meeting these higher standards.
As an example of how this syndrome occurs, assume that an individual is a grade 20.
Because he or she is a “distinguished performer,” exceeding the standards of the position, man-
agement decides to incorporate these higher standards into the job description, making them
the normal requirements. The position now merits a grade 23 rather than 20. Unless perform-
ance is further elevated, the individual should not be judged above “very good”—he or she is
simply meeting, not exceeding, the new and higher job standards. Using Table 5-5, assume a
current salary of $250,000 and merit increases as shown in Table 5-26. “Distinguished” per-
formance in the middle one-third of grade 20 calls for an 11 percent increase. Having been