
Page 228 - Bruce Ellig - The Complete Guide to Executive Compensation (2007)
P. 228
214 The Complete Guide to Executive Compensation
Several approaches to developing the control total include (1) projection of most recent
actual performance by individual, (2) weighting individual performance in accord with
desired performance distribution, and (3) using the described average performance rating.
Using the Most Recent Performance Rating. Projection of the most recent actual per-
formance rating assumes that each individual will have the same rating as last year. Thus, if
the person was “outstanding” last year and a current salary of $360,000 placed the individual
in the middle one-third of grade 24, a 13 percent increase, or $46,800, is suggested.
Repeating the process for all employees generates a total (which can be increased or
decreased by top management in accord with willingness and ability to pay). The problems
with this approach are (1) its static nature, assuming neither an increase nor a decrease in per-
formance one year to the next, (2) the lack of a previous rating for newly hired individuals,
and (3) the questionable use of a rating at a lower grade for a recently promoted person.
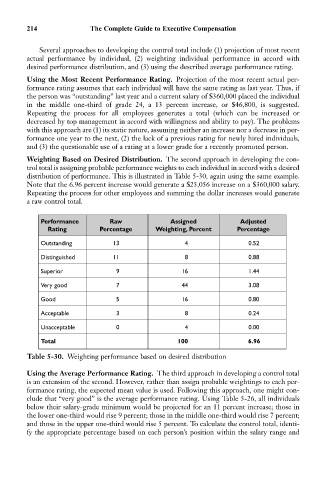
Weighting Based on Desired Distribution. The second approach in developing the con-
trol total is assigning probable performance weights to each individual in accord with a desired
distribution of performance. This is illustrated in Table 5-30, again using the same example.
Note that the 6.96 percent increase would generate a $25,056 increase on a $360,000 salary.
Repeating the process for other employees and summing the dollar increases would generate
a raw control total.
Performance Raw Assigned Adjusted
Rating Percentage Weighting, Percent Percentage
Outstanding 13 4 0.52
Distinguished 11 8 0.88
Superior 9 16 1.44
Very good 7 44 3.08
Good 5 16 0.80
Acceptable 3 8 0.24
Unacceptable 0 4 0.00
Total 100 6.96
Table 5-30. Weighting performance based on desired distribution
Using the Average Performance Rating. The third approach in developing a control total
is an extension of the second. However, rather than assign probable weightings to each per-
formance rating, the expected mean value is used. Following this approach, one might con-
clude that “very good” is the average performance rating. Using Table 5-26, all individuals
below their salary-grade minimum would be projected for an 11 percent increase; those in
the lower one-third would rise 9 percent; those in the middle one-third would rise 7 percent;
and those in the upper one-third would rise 5 percent. To calculate the control total, identi-
fy the appropriate percentage based on each person’s position within the salary range and