
Page 229 - Bruce Ellig - The Complete Guide to Executive Compensation (2007)
P. 229
Chapter 5. Salary 215
multiply it by the person’s salary and then sum the dollar increases for each person, resulting
in a control total dollar of salary increases.
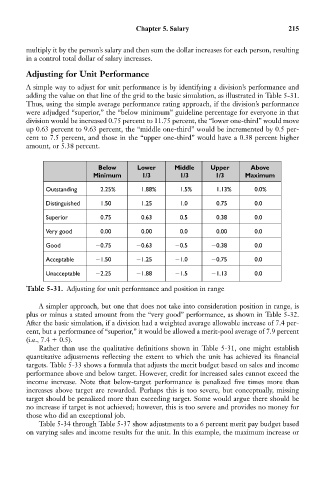
Adjusting for Unit Performance
A simple way to adjust for unit performance is by identifying a division’s performance and
adding the value on that line of the grid to the basic simulation, as illustrated in Table 5-31.
Thus, using the simple average performance rating approach, if the division’s performance
were adjudged “superior,” the “below minimum” guideline percentage for everyone in that
division would be increased 0.75 percent to 11.75 percent, the “lower one-third” would move
up 0.63 percent to 9.63 percent, the “middle one-third” would be incremented by 0.5 per-
cent to 7.5 percent, and those in the “upper one-third” would have a 0.38 percent higher
amount, or 5.38 percent.
Below Lower Middle Upper Above
Minimum 1/3 1/3 1/3 Maximum
Outstanding 2.25% 1.88% 1.5% 1.13% 0.0%
Distinguished 1.50 1.25 1.0 0.75 0.0
Superior 0.75 0.63 0.5 0.38 0.0
Very good 0.00 0.00 0.0 0.00 0.0
Good 0.75 0.63 0.5 0.38 0.0
Acceptable 1.50 1.25 1.0 0.75 0.0
Unacceptable 2.25 1.88 1.5 1.13 0.0
Table 5-31. Adjusting for unit performance and position in range
A simpler approach, but one that does not take into consideration position in range, is
plus or minus a stated amount from the “very good” performance, as shown in Table 5-32.
After the basic simulation, if a division had a weighted average allowable increase of 7.4 per-
cent, but a performance of “superior,” it would be allowed a merit-pool average of 7.9 percent
(i.e., 7.4 0.5).
Rather than use the qualitative definitions shown in Table 5-31, one might establish
quantitative adjustments reflecting the extent to which the unit has achieved its financial
targets. Table 5-33 shows a formula that adjusts the merit budget based on sales and income
performance above and below target. However, credit for increased sales cannot exceed the
income increase. Note that below-target performance is penalized five times more than
increases above target are rewarded. Perhaps this is too severe, but conceptually, missing
target should be penalized more than exceeding target. Some would argue there should be
no increase if target is not achieved; however, this is too severe and provides no money for
those who did an exceptional job.
Table 5-34 through Table 5-37 show adjustments to a 6 percent merit pay budget based
on varying sales and income results for the unit. In this example, the maximum increase or