
Page 378 - Bruce Ellig - The Complete Guide to Executive Compensation (2007)
P. 378
364 The Complete Guide to Executive Compensation
bonus candidates; or a percentage of the fund based on organizational responsibilities. An
example of the latter is shown in Table 7-17. This type is most likely in midsized companies.
The fund itself might have been generated by a percentage of net income, the most common
being the profit-sharing plan.
Position Percentage of the Fund
CEO 30%
COO 20
CFO 10
VPs (8) 5
Total 100%
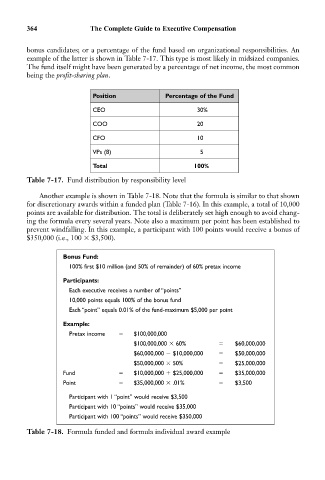
Table 7-17. Fund distribution by responsibility level
Another example is shown in Table 7-18. Note that the formula is similar to that shown
for discretionary awards within a funded plan (Table 7-16). In this example, a total of 10,000
points are available for distribution. The total is deliberately set high enough to avoid chang-
ing the formula every several years. Note also a maximum per point has been established to
prevent windfalling. In this example, a participant with 100 points would receive a bonus of
$350,000 (i.e., 100 $3,500).
Bonus Fund:
100% first $10 million (and 50% of remainder) of 60% pretax income
Participants:
Each executive receives a number of “points”
10,000 points equals 100% of the bonus fund
Each “point” equals 0.01% of the fund-maximum $5,000 per point
Example:
Pretax income $100,000,000
$100,000,000 60% $60,000,000
$60,000,000 $10,000,000 $50,000,000
$50,000,000 50% $25,000,000
Fund $10,000,000 $25,000,000 $35,000,000
Point $35,000,000 .01% $3,500
Participant with 1 “point” would receive $3,500
Participant with 10 “points” would receive $35,000
Participant with 100 “points” would receive $350,000
Table 7-18. Formula funded and formula individual award example