
Page 374 - Bruce Ellig - The Complete Guide to Executive Compensation (2007)
P. 374
360 The Complete Guide to Executive Compensation
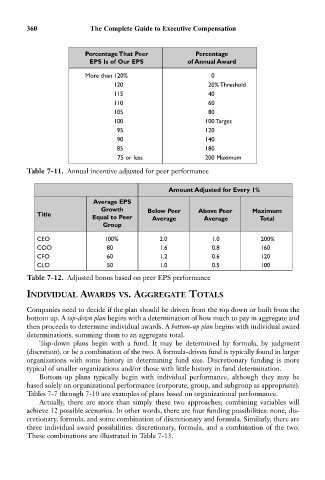
Percentage That Peer Percentage
EPS Is of Our EPS of Annual Award
More than 120% 0
120 20% Threshold
115 40
110 60
105 80
100 100 Target
95 120
90 140
85 180
75 or less 200 Maximum
Table 7-11. Annual incentive adjusted for peer performance
Amount Adjusted for Every 1%
Average EPS
Growth Below Peer Above Peer Maximum
Title
Equal to Peer Average Average Total
Group
CEO 100% 2.0 1.0 200%
COO 80 1.6 0.8 160
CFO 60 1.2 0.6 120
CLO 50 1.0 0.5 100
Table 7-12. Adjusted bonus based on peer EPS performance
INDIVIDUAL AWARDS VS. AGGREGATE TOTALS
Companies need to decide if the plan should be driven from the top down or built from the
bottom up. A top-down plan begins with a determination of how much to pay in aggregate and
then proceeds to determine individual awards. A bottom-up plan begins with individual award
determinations, summing them to an aggregate total.
Top-down plans begin with a fund. It may be determined by formula, by judgment
(discretion), or be a combination of the two. A formula-driven fund is typically found in larger
organizations with some history in determining fund size. Discretionary funding is more
typical of smaller organizations and/or those with little history in fund determination.
Bottom-up plans typically begin with individual performance, although they may be
based solely on organizational performance (corporate, group, and subgroup as appropriate).
Tables 7-7 through 7-10 are examples of plans based on organizational performance.
Actually, there are more than simply these two approaches; combining variables will
achieve 12 possible scenarios. In other words, there are four funding possibilities: none, dis-
cretionary, formula, and some combination of discretionary and formula. Similarly, there are
three individual award possibilities: discretionary, formula, and a combination of the two.
These combinations are illustrated in Table 7-13.