
Page 371 - Bruce Ellig - The Complete Guide to Executive Compensation (2007)
P. 371
Chapter 7. Short-Term Incentives 357
Actual Results
Company Results Previous Year Last Year % Change
Sales per share $20.48 $21.49 4.9%
Earnings per share* 2.13 2.41 13.2%*
Incentive Plan Formula
Sales per share 4.9% inc 0
Earnings per share 4.9% inc 0
Total 0% of salary
Recalculated for Ongoing Businesses
Company Results Previous Year Last Year % Change
Sales per share $17.49 $20.43 16.8%
Earnings per share* 2.13 3.06 17.7%*
Incentive Plan Formula
Sales per share 16.8% inc 34.0
Earnings per share 16.8% inc 34.0
Total 68% of salary
* Cannot exceed increase in sales per share
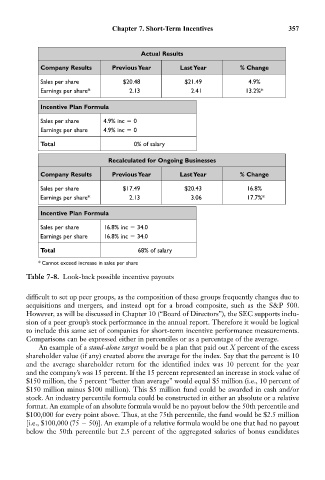
Table 7-8. Look-back possible incentive payouts
difficult to set up peer groups, as the composition of these groups frequently changes due to
acquisitions and mergers, and instead opt for a broad composite, such as the S&P 500.
However, as will be discussed in Chapter 10 (“Board of Directors”), the SEC supports inclu-
sion of a peer group’s stock performance in the annual report. Therefore it would be logical
to include this same set of companies for short-term incentive performance measurements.
Comparisons can be expressed either in percentiles or as a percentage of the average.
An example of a stand-alone target would be a plan that paid out X percent of the excess
shareholder value (if any) created above the average for the index. Say that the percent is 10
and the average shareholder return for the identified index was 10 percent for the year
and the company’s was 15 percent. If the 15 percent represented an increase in stock value of
$150 million, the 5 percent “better than average” would equal $5 million (i.e., 10 percent of
$150 million minus $100 million). This $5 million fund could be awarded in cash and/or
stock. An industry percentile formula could be constructed in either an absolute or a relative
format. An example of an absolute formula would be no payout below the 50th percentile and
$100,000 for every point above. Thus, at the 75th percentile, the fund would be $2.5 million
[i.e., $100,000 (75 50)]. An example of a relative formula would be one that had no payout
below the 50th percentile but 2.5 percent of the aggregated salaries of bonus candidates