
Page 370 - Bruce Ellig - The Complete Guide to Executive Compensation (2007)
P. 370
356 The Complete Guide to Executive Compensation
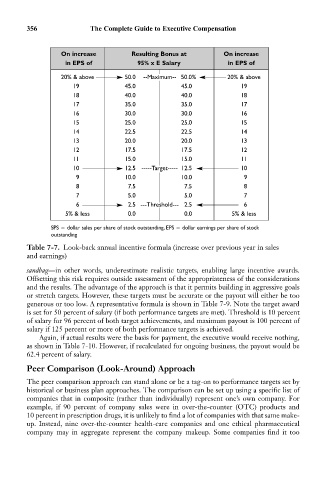
On increase Resulting Bonus at On increase
in EPS of 95% x E Salary in EPS of
20% & above 50.0 --Maximum-- 50.0% 20% & above
19 45.0 45.0 19
18 40.0 40.0 18
17 35.0 35.0 17
16 30.0 30.0 16
15 25.0 25.0 15
14 22.5 22.5 14
13 20.0 20.0 13
12 17.5 17.5 12
11 15.0 15.0 11
10 12.5 -----Target----- 12.5 10
9 10.0 10.0 9
8 7.5 7.5 8
7 5.0 5.0 7
6 2.5 ---Threshold--- 2.5 6
5% & less 0.0 0.0 5% & less
SPS dollar sales per share of stock outstanding, EPS dollar earnings per share of stock
outstanding
Table 7-7. Look-back annual incentive formula (increase over previous year in sales
and earnings)
sandbag—in other words, underestimate realistic targets, enabling large incentive awards.
Offsetting this risk requires outside assessment of the appropriateness of the considerations
and the results. The advantage of the approach is that it permits building in aggressive goals
or stretch targets. However, these targets must be accurate or the payout will either be too
generous or too low. A representative formula is shown in Table 7-9. Note the target award
is set for 50 percent of salary (if both performance targets are met). Threshold is 10 percent
of salary for 96 percent of both target achievements, and maximum payout is 100 percent of
salary if 125 percent or more of both performance targets is achieved.
Again, if actual results were the basis for payment, the executive would receive nothing,
as shown in Table 7-10. However, if recalculated for ongoing business, the payout would be
62.4 percent of salary.
Peer Comparison (Look-Around) Approach
The peer comparison approach can stand alone or be a tag-on to performance targets set by
historical or business plan approaches. The comparison can be set up using a specific list of
companies that in composite (rather than individually) represent one’s own company. For
example, if 90 percent of company sales were in over-the-counter (OTC) products and
10 percent in prescription drugs, it is unlikely to find a lot of companies with that same make-
up. Instead, nine over-the-counter health-care companies and one ethical pharmaceutical
company may in aggregate represent the company makeup. Some companies find it too