
Page 373 - Bruce Ellig - The Complete Guide to Executive Compensation (2007)
P. 373
Chapter 7. Short-Term Incentives 359
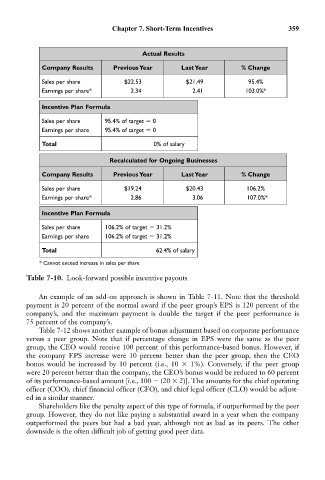
Actual Results
Company Results Previous Year Last Year % Change
Sales per share $22.53 $21.49 95.4%
Earnings per share* 2.34 2.41 103.0%*
Incentive Plan Formula
Sales per share 95.4% of target 0
Earnings per share 95.4% of target 0
Total 0% of salary
Recalculated for Ongoing Businesses
Company Results Previous Year Last Year % Change
Sales per share $19.24 $20.43 106.2%
Earnings per share* 2.86 3.06 107.0%*
Incentive Plan Formula
Sales per share 106.2% of target 31.2%
Earnings per share 106.2% of target 31.2%
Total 62.4% of salary
* Cannot exceed increase in sales per share
Table 7-10. Look-forward possible incentive payouts
An example of an add-on approach is shown in Table 7-11. Note that the threshold
payment is 20 percent of the normal award if the peer group’s EPS is 120 percent of the
company’s, and the maximum payment is double the target if the peer performance is
75 percent of the company’s.
Table 7-12 shows another example of bonus adjustment based on corporate performance
versus a peer group. Note that if percentage change in EPS were the same as the peer
group, the CEO would receive 100 percent of this performance-based bonus. However, if
the company EPS increase were 10 percent better than the peer group, then the CEO
bonus would be increased by 10 percent (i.e., 10 1%). Conversely, if the peer group
were 20 percent better than the company, the CEO’s bonus would be reduced to 60 percent
of its performance-based amount [i.e., 100 (20 2)]. The amounts for the chief operating
officer (COO), chief financial officer (CFO), and chief legal officer (CLO) would be adjust-
ed in a similar manner.
Shareholders like the penalty aspect of this type of formula, if outperformed by the peer
group. However, they do not like paying a substantial award in a year when the company
outperformed the peers but had a bad year, although not as bad as its peers. The other
downside is the often difficult job of getting good peer data.