
Page 57 - Bruce Ellig - The Complete Guide to Executive Compensation (2007)
P. 57
Chapter 2. Performance Measurements and Standards 43
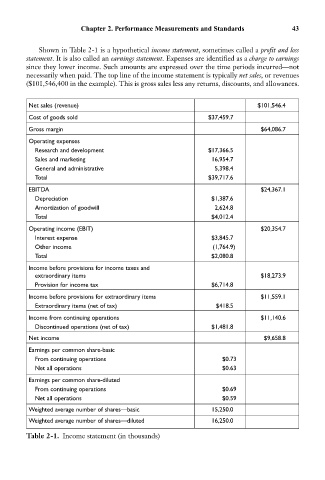
Shown in Table 2-1 is a hypothetical income statement, sometimes called a profit and loss
statement. It is also called an earnings statement. Expenses are identified as a charge to earnings
since they lower income. Such amounts are expressed over the time periods incurred—not
necessarily when paid. The top line of the income statement is typically net sales, or revenues
($101,546,400 in the example). This is gross sales less any returns, discounts, and allowances.
Net sales (revenue) $101,546.4
Cost of goods sold $37,459.7
Gross margin $64,086.7
Operating expenses
Research and development $17,366.5
Sales and marketing 16,954.7
General and administrative 5,398.4
Total $39,717.6
EBITDA $24,367.1
Depreciation $1,387.6
Amortization of goodwill 2,624.8
Total $4,012.4
Operating income (EBIT) $20,354.7
Interest expense $3,845.7
Other income (1,764.9)
Total $2,080.8
Income before provisions for income taxes and
extraordinary items $18,273.9
Provision for income tax $6,714.8
Income before provisions for extraordinary items $11,559.1
Extraordinary items (net of tax) $418.5
Income from continuing operations $11,140.6
Discontinued operations (net of tax) $1,481.8
Net income $9,658.8
Earnings per common share-basic
From continuing operations $0.73
Net all operations $0.63
Earnings per common share-diluted
From continuing operations $0.69
Net all operations $0.59
Weighted average number of shares—basic 15,250.0
Weighted average number of shares—diluted 16,250.0
Table 2-1. Income statement (in thousands)