
Page 61 - Bruce Ellig - The Complete Guide to Executive Compensation (2007)
P. 61
Chapter 2. Performance Measurements and Standards 47
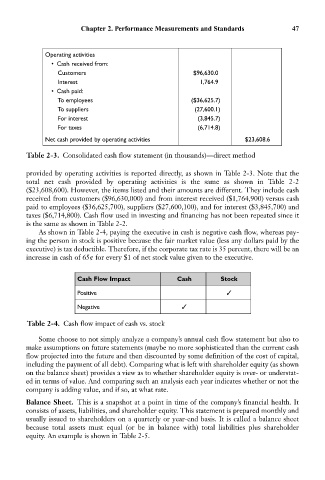
Operating activities
• Cash received from:
Customers $96,630.0
Interest 1,764.9
• Cash paid:
To employees ($36,625.7)
To suppliers (27,600.1)
For interest (3,845.7)
For taxes (6,714.8)
Net cash provided by operating activities $23,608.6
Table 2-3. Consolidated cash flow statement (in thousands)—direct method
provided by operating activities is reported directly, as shown in Table 2-3. Note that the
total net cash provided by operating activities is the same as shown in Table 2-2
($23,608,600). However, the items listed and their amounts are different. They include cash
received from customers ($96,630,000) and from interest received ($1,764,900) versus cash
paid to employees ($36,625,700), suppliers ($27,600,100), and for interest ($3,845,700) and
taxes ($6,714,800). Cash flow used in investing and financing has not been repeated since it
is the same as shown in Table 2-2.
As shown in Table 2-4, paying the executive in cash is negative cash flow, whereas pay-
ing the person in stock is positive because the fair market value (less any dollars paid by the
executive) is tax deductible. Therefore, if the corporate tax rate is 35 percent, there will be an
increase in cash of 65¢ for every $1 of net stock value given to the executive.
Cash Flow Impact Cash Stock
Positive
Negative
Table 2-4. Cash flow impact of cash vs. stock
Some choose to not simply analyze a company’s annual cash flow statement but also to
make assumptions on future statements (maybe no more sophisticated than the current cash
flow projected into the future and then discounted by some definition of the cost of capital,
including the payment of all debt). Comparing what is left with shareholder equity (as shown
on the balance sheet) provides a view as to whether shareholder equity is over- or understat-
ed in terms of value. And comparing such an analysis each year indicates whether or not the
company is adding value, and if so, at what rate.
Balance Sheet. This is a snapshot at a point in time of the company’s financial health. It
consists of assets, liabilities, and shareholder equity. This statement is prepared monthly and
usually issued to shareholders on a quarterly or year-end basis. It is called a balance sheet
because total assets must equal (or be in balance with) total liabilities plus shareholder
equity. An example is shown in Table 2-5.