
Page 64 - Bruce Ellig - The Complete Guide to Executive Compensation (2007)
P. 64
50 The Complete Guide to Executive Compensation
stock outstanding ($152,500) and additional paid-in capital (dollars received for sale of com-
pany stock less par value, or $119,113,200). Thus, when a stock option is exercised, the pro-
ceeds from the option are split between the par value and additional paid-in capital accounts.
If the par value is $.01 and the option price is $10, the par value account would receive $.01
and the other $9.99 would go to the additional paid in capital account. Retained earnings are
the cumulative effect of net income minus paid dividends ($24,173,900). Dollars paid to buy
back company stock ($6,362,200), which becomes treasury stock (795,200 shares), are also
shown. In Table 2-8, total shareholder equity is $137,077,400.
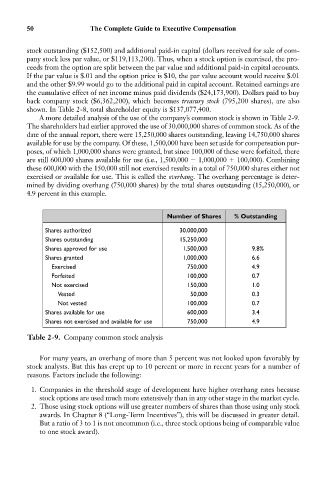
A more detailed analysis of the use of the company’s common stock is shown in Table 2-9.
The shareholders had earlier approved the use of 30,000,000 shares of common stock. As of the
date of the annual report, there were 15,250,000 shares outstanding, leaving 14,750,000 shares
available for use by the company. Of these, 1,500,000 have been set aside for compensation pur-
poses, of which 1,000,000 shares were granted, but since 100,000 of these were forfeited, there
are still 600,000 shares available for use (i.e., 1,500,000 1,000,000 100,000). Combining
these 600,000 with the 150,000 still not exercised results in a total of 750,000 shares either not
exercised or available for use. This is called the overhang. The overhang percentage is deter-
mined by dividing overhang (750,000 shares) by the total shares outstanding (15,250,000), or
4.9 percent in this example.
Number of Shares % Outstanding
Shares authorized 30,000,000
Shares outstanding 15,250,000
Shares approved for use 1,500,000 9.8%
Shares granted 1,000,000 6.6
Exercised 750,000 4.9
Forfeited 100,000 0.7
Not exercised 150,000 1.0
Vested 50,000 0.3
Not vested 100,000 0.7
Shares available for use 600,000 3.4
Shares not exercised and available for use 750,000 4.9
Table 2-9. Company common stock analysis
For many years, an overhang of more than 5 percent was not looked upon favorably by
stock analysts. But this has crept up to 10 percent or more in recent years for a number of
reasons. Factors include the following:
1. Companies in the threshold stage of development have higher overhang rates because
stock options are used much more extensively than in any other stage in the market cycle.
2. Those using stock options will use greater numbers of shares than those using only stock
awards. In Chapter 8 (“Long-Term Incentives”), this will be discussed in greater detail.
But a ratio of 3 to 1 is not uncommon (i.e., three stock options being of comparable value
to one stock award).