
Page 288 - The extraordinary leader
P. 288
Measuring Leadership Improvement at General Mills • 265
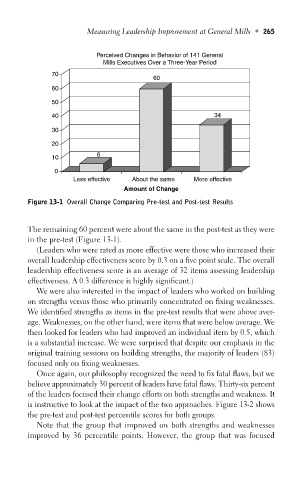
Perceived Changes in Behavior of 141 General
Mills Executives Over a Three-Year Period
70
60
60
50
40 34
30
20
6
10
0
Less effective About the same More effective
Amount of Change
Figure 13-1 Overall Change Comparing Pre-test and Post-test Results
The remaining 60 percent were about the same in the post-test as they were
in the pre-test (Figure 13-1).
(Leaders who were rated as more effective were those who increased their
overall leadership effectiveness score by 0.3 on a five point scale. The overall
leadership effectiveness score is an average of 32 items assessing leadership
effectiveness. A 0.3 difference is highly significant.)
We were also interested in the impact of leaders who worked on building
on strengths versus those who primarily concentrated on fixing weaknesses.
We identified strengths as items in the pre-test results that were above aver-
age. Weaknesses, on the other hand, were items that were below average. We
then looked for leaders who had improved an individual item by 0.5, which
is a substantial increase. We were surprised that despite our emphasis in the
original training sessions on building strengths, the majority of leaders (83)
focused only on fixing weaknesses.
Once again, our philosophy recognized the need to fix fatal flaws, but we
believe approximately 30 percent of leaders have fatal flaws. Thirty-six percent
of the leaders focused their change efforts on both strengths and weakness. It
is instructive to look at the impact of the two approaches. Figure 13-2 shows
the pre-test and post-test percentile scores for both groups.
Note that the group that improved on both strengths and weaknesses
improved by 36 percentile points. However, the group that was focused