
Page 15 - The Geological Interpretation of Well Logs
P. 15
- INTRODUCTION -
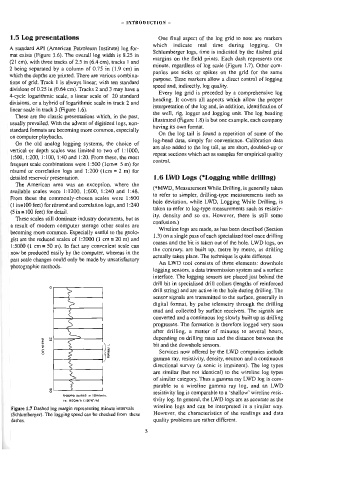
1.5 Log presentations One final aspect of the log grd to note are markers
which indicate real time during logging. On
A standard API (American Petroleum Institute) Jog for-
Schlumberger logs, time is indicated by the dashed grid
mat exists (Figure 1.6). The overall log width is 8.25 in
margins on the field prints. Each dash represents one
(21 cm), with three tracks of 2.5 in (6.4 cm), tracks 1 and
minute, regardless of log scale (Figure 1.7). Other com-
2 being separated by a column of 0.75 in (1.9 cm) in
panies use ticks or spikes on the grid for the same
which the depths are printed. There are various combina-
purpose. Time markers allow a direct contro] of logging
tions of grid. Track 1 is always linear, with ten standard
speed and, indirectly, log quality.
divisions of 0.25 in (0.64 cm). Tracks 2 and 3 may have a
Every log grid is preceded by a comprehensive log
4-cycle logarithmic scale, a linear scale of 20 standard
heading. It covers all aspects which allow the proper
divisions, or a hybrid of logarithmic scale in track 2 and
interpretation of the log and, in addition, identification of
linear scale in track 3 (Figure 1.6).
the well, rig, logger and logging unit. The log heading
These are the classic presentations which, in the past,
illustrated (Figure 1.8) is but one example, each company
usually prevailed. With the advent of digitized logs, non-
having its own format.
standard formats are becoming more common, especially
On the log tail is found a repetition of some of the
on computer playbacks.
log-head data, simply for convenience. Calibration data
On the old analog togging systems, the choice of
are also added to the log tail, as are short, doubled-up or
vertical or depth scales was limited to two of 1:1000,
repeat sections which act as samples for empirical quality
1:500, t:200, 1:100, 1:40 and 1:20. From these, the most
control.
frequent scale combinations were 1:500 (lem= 5 m) for
résumé or correlation logs and 1:200 (lcm = 2 m) for
detailed reservoir presentation. 1.6 LWD Logs (*Logging while drilling)
The American area was an exception, where the
(*MWD, Measurement While Drilling, is generally taken
available scales were 1:1200, 1:600, 1:240 and 1:48.
to refer to simpler, drilling-type measurements such as
From these the commonly-chosen scales were 1:600
hole deviation, while LWD, Logging While Drilling, is
(t in=100 feet) for résumé and correlation logs, and 1:240
taken to refer to log-type measurements such as resistiv-
(5 in=100 feet) for detail.
ity, density and so on. However, there is still some
These scales still dominate industry documents, but as
confusion.)
a result of modern computer storage other scales are
Wireline logs are made, as has been described (Section
becoming more common. Especially useful to the gealo-
1.3) on a single pass of each specialized tool once drilling
gist are the reduced scales of 1:2000 (1 cm = 20 m) and
ceases and the bit is taken out of the hole. LWD logs, on
1:5000 (1 cm = 50 m). In fact any convenient scale can
the contrary, are built up, metre by metre, as drilling
now be produced easily by the computer, whereas in the
actually takes place. The technique is quite different.
past scale changes could only be made by unsatisfactory
An LWD tool consists of three elements: downhote
photographic methods.
logging sensors, a data transmission system and a surface
interface. The logging sensors are placed just behind the
drill bit in specialised drill collars (lengths of reinforced
drill string) and are active in the hole during drilling. The
Ayn fev]
sensor signals are transmitted to the surface, generally in
digital format, by pulse telemetry through the drilling
mud and collected by surface receivers. The signals are
converted and a continuous log slowly built up as drilling
progresses. The formation is therefore logged very soon
after drilling, a matter of minutes to several hours,
yidep se | depending on drilling rates and the distance between the
rinry
bit and the downhole sensors.
(w) opquw Services now offered by the LWD companies include
gamma ray, resistivity, density, neutron and a continuous
directional survey (a sonic is imminent). The log types
are similar (but not identical) to the wireline log types
of similar category. Thus a gamma ray LWD log is com-
og parable to a wireline gamma ray log, and an LWD
resistivity log is comparable to a ‘shallow’ wireline resis-
logging speed = 10m/min,
tivity log. In general, the LWD logs are as accurate as the
i.e. 6OOmséh (19707/b)
wireline logs and can be interpreted in a similar way.
Figure 1.7 Dashed log margin representing minute intervals
(Schlumberger). The logging speed can be checked from these However, the characteristics of the readings and data
dashes. quality problems are rather different.