
Page 20 - The Geological Interpretation of Well Logs
P. 20
- THE GEOLOGICAL INTERPRETATION OF WELL LOGS -
of 1.09 g/cm? (at 15.5°C). A column of water of this the brake puts the fluid under overpressure: it is being
salinity will have a gradient of 1.09 g/cm? and at 2500 m squeezed by the extra pressure of the foot.
will exert a pressure of Generally, most wells drilled show a typical subsurface
pressure development. Shallow formations have ‘normal’
2500%1-09 _272.5kg/ cm’ or hydrostatic formation pressures: there is no rock
(3) squeezing, no overpressure. Deeper into the subsurface
slight overpressures are encountered so there is slight
Figure 2.1 shows the various gradients for fluids of squeezing. As the depths increase, so the overpressure
different densities and the increases with depth. All increases and the formation fluids support more of the
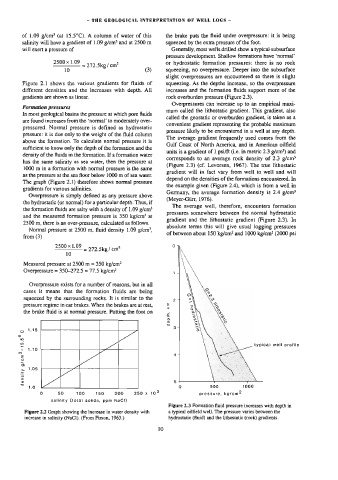
gradients are shown as linear. rock overburden pressure (Figure 2.3).
Overpressures can increase up to an empirical maxi-
Formation pressures
mum called the lithostatic gradient. This gradient, also
In most geological basins the pressure at which pore fluids
called the geostatic or overburden gradient, is taken as a
are found increases from the ‘normal’ to moderately over-
convenient gradient representing the probable maximum
pressured. Normal pressure is defined as hydrostatic
pressure likely to be encountered in a well at any depth.
pressure: it is due only to the weight of the fluid column
The average gradient frequently used comes from the
above the formation. To calculate normal pressure it is
Gulf Coast of North America, and in American oilfield
sufficient to know only the depth of the formation and the
units is a gradient of 1 psi/ft (i.e. in metric 2.3 g/cm?) and
density of the fluids in the formation. If a formation water
corresponds to an average rock density of 2.3 g/cm?
has the same salinity as sea water, then the pressure at
(Figure 2.3) (cf. Levorsen, 1967). The true lithostatic
1000 m in a formation with normal pressure is the same
gradient will in fact vary from well to well and will
as the pressure at the sea floor below 1000 m of sea water.
depend on the densities of the formations encountered. In
The graph (Figure 2.1) therefore shows normal pressure
the example given (Figure 2.4), which is from a well in
gradients for various salinities.
Germany, the average formation density is 2.4 g/cm?
Overpressure is simply defined as any pressure above
(Meyer-Giirr, 1976).
the hydrostatic (or normal) for a particular depth. Thus, if
The average well, therefore, encounters formation
the formation fluids are salty with a density of 1.09 g/cm?
pressures somewhere between the normal hydrostatic
and the measured formation pressure is 350 kg/cm? at
gradient and the lithostatic gradient (Figure 2.3). In
2500 m, there is an over-pressure, calculated as follows.
absolute terms this will give usual logging pressures
Normal pressure at 2500 m, fluid density 1.09 g/cm’,
of between about 150 kg/cm? and 1000 kg/cm? (2000 psi
from (3)
2500 1.09
x
= 272.5kg / cm”
10
Measured pressure at 2500 m = 350 kg/cm?
Overpressure = 350-272.5 = 77.5 kg/cm?
Overpressure exists for a number of reasons, but in all
cases it means that the formation fluids are being
squeezed by the surrounding rocks. It is similar to the
km
pressure regime in car brakes. When the brakes are at rest,
the brake fluid is at normal pressure. Putting the foot on
depth,
Oo 1.15
Q
©
Ww
typical well profile
1.1
o a a
E Lo
Qo
mo |
> 1.05
3 ea
c
T
oD 5
——T
~
> 1.0 0 $00 1000
0 50 100 150 200 250 x 103 pressure, kg/em?
salinity (otal solids, pom NaC)
Figure 2.3 Formation fluid pressure increases with depth in
Figure 2.2 Graph showing the increase in water density with a typical oilfield well. The pressure varies between the
increase in salinity (NaCl). (From Pirson, 1963.) hydrostatic (fluid) and the lithostatic (rock) gradients.
10