
Page 25 - The Geological Interpretation of Well Logs
P. 25
- THE LOGGING ENVIRONMENT -
Formation
Table 2.4 * Vertical resolution of some logging tools
model Log
(from Theys, 1991).
*see Figure 2.11
Logging tool Vertical Resolution
measurement inches cm
FMS/FMI (individual
VERTICAL
SHDT dipmeter curves | 0.4" 1.0em
electrodes) 0.2” 0.5cm
RESOLUTION
af2 | af2 HDT dipmeter curves 0.5" 1.3cm
Microlog 2"-4" Sem-10cm
Micro Spherically
i
Focused Resistivity 2"-3" Sem-7.6cm
total Phasor Induction SFL:
deflection deep 84"-96" (7-8) 2.0m
medium 60"-72" (5'-6') 1.5m
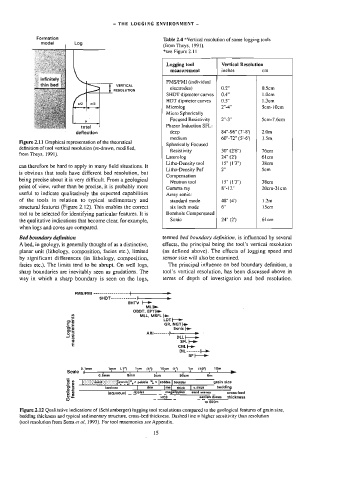
Figure 2.11 Graphical representation of the theoretical
Spherically Focused
definition of tool vertical resolution (re-drawn, modified,
Resistivity 30" (2'6") 76cm
from Theys, 1991).
Laterolog 24" (2') 6lom
Litho-Density tool 15" (1'3") 38cm
can therefore be hard to apply in many field situations. It
Litho-Density Pef 2" Sem
is Obvious that tools have different bed resolution, but
Compensation
being precise about it is very difficult. From a geological
Neutron tool 15" (13°) 38cm
point of view, rather than be precise, it is probably more Gamma ray 8”-12" 20cm-3 lcm
when logs and cores are compared.
useful to indicate qualitatively the expected capabilities Array sonic:
of the tools in relation to typical sedimentary and standard mode 48" (4 1.2m
15cm
6”
structural features (Figure 2.12). This enables the correct
six inch mode
tool to be selected for identifying particular features. It is Borehole Compensated
the qualitative indications that become clear, for example, Sonic 24" (2') 6lem
Bed boundary definition termed bed boundary definition, is influenced by several
A bed, in geology, is generally thought of as a distinctive, effects, the principal being the tool’s vertical resolution
planar unit (lithology, composition, facies etc.), limited (as defined above). The effects of logging speed and
by significant differences (in lithology, composition, sensor size will also be examined,
facies etc.). The limits tend to be abrupt. On well logs, The principal influence on bed boundary definition, a
sharp boundaries are inevitably seen as gradations. The tool’s vertical resolution, has been discussed above in
way in which a sharp boundary is seen on the logs, terms of depth of investigation and bed resolution.
FMS/FMI ------~---------- +——_____—+-
SHDT-----------= -—————“
BHTV |»
ML f=
OBDT, EPT He te
MLL, MSFL
oe LDT }—»
£¢e GR, NGT be
3 o Sonic He
o3 ARI-—------
32%
DLL -+—»
2 SFL >
CNL Ee
DIL ------ b-
SP. -}—
0.1mm tmm (.7%} tem {1 10cm {t) Im = {0} 10m
1
1
L
r
qt
1
Scale _-
vi
1
+
1
1")
1
1
rt
1
0.6mm 5mm bem 50cm 6m
g 2 SJ oronute|*,o pebble 9, © [cobble | boulder grain size
BS laminae thin [me] thick | v.thlok bedding
3 3 faqueous) _ Apples _ _megaripples send waves _ cross-bed
& - HCS _seolian dunes thickness
to 600m
Figure 2.12 Qualitative indications of (Schlumberger) togging tool resolutions compared to the geological features of grain size,
bedding thickness and typical sedimentary structure, cross-bed thickness. Dashed line = higher sensitivity than resolution
(tool resolution from Serra et af, 1993). For tool mnemonics see Appendix.
15