
Page 26 - The Geological Interpretation of Well Logs
P. 26
~- THE GEOLOGICAL INTERPRETATION OF WELL LOGS -
o «GR (API)
120
However, vertical resolution characteristics also influence
tool response at any sharp bed boundary. A tool with a
large vertical resolution will show a very gradual
response, even at a sharp boundary, while a tool with a
small vertical resolution will show a much more rapid
response (Figure 2.10, 3). If, for example, a tool has a
vertical resolution of 2 m, then over a minimum of | m
(Figure 2.11), the signals from the bed above and from
the bed below will be totally mixed. This will produce a shoutder
progressive response over | m, typically called a shoulder effect
Log @
effect, a name which covers the special, sometimes
predictable tool effects at sharp surfaces between
different beds (i.e. lithologies). In the present example, sand
over the 1m of jog which shows shoulder effects, the
contributions of the two lithologies are being mixed in
constantly varying proportions, the actual log values
being more indicative of the tool position relative to the am
bed boundary, than to the values of the beds themselves. shoulder
These shoulder effects are obviously much reduced in atfect
vertical thickness in tools with small vertical resolution: Log @)
in these, bed boundary definition is good (Figure 2.10, 3).
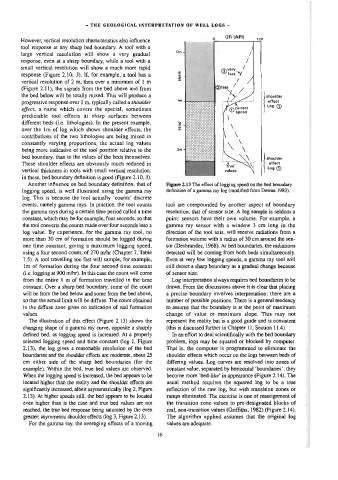
Another influence on bed boundary definition, that of Figure 2.13 The effect of logging speed on the bed boundary
logging speed, is well illustrated using the gamma ray definition of a gamma ray log (modified from Dewan 1983).
log. This is because the tool actuajly ‘counts’ discrete
events, namely gamma rays. In practice, the tool counts tool are compounded by another aspect of boundary
the gamma rays during a certain time period called a time resolution, that of sensor size. A log sample is seldom a
constant, which may be for example, four seconds, so that point: sensors have their own volume. For example, a
the tool converts the counts made over four seconds into a gamma ray sensor with a window 3 cm long in the
log value. By experience, for the gamma ray tool, no direction of the tool axis, will receive radiations from a
more than 30 cm of formation should be logged during formation volume with a radius of 30 cm around the sen-
one time constant, giving a maximum logging speed, sor (Desbrandes, 1968). At bed boundaries, the radiations
using a four second count, of 270 m/hr (Chapter 7, Table detected will be coming from both beds simultaneously.
7.5). A tool travelling too fast will sample, for example, Even at very Jow logging speeds, a gamma ray tool will
1m of formation during the four second time constant still detect a sharp boundary as a gradual change because
(i.e. logging at 900 m/hr). In this case the count will come of sensor size.
from the entire 1 m of formation travelled in the time Log interpretation always requires bed boundaries to be
constant, Over a sharp bed boundary, some of the count drawn. From the discussions above it is clear that placing
will be from the bed below and some from the bed above, a precise boundary involves interpretation: there are a
so that the actual limit will be diffuse, The count obtained number of possibie positions. There is a general tendency
in the diffuse zone gives no indication of real formation to assume that the boundary is at the point of maximum
values. change of value or maximum slope. This may not
The illustration of this effect (Figure 2.13) shows the represent the reality but is a good guide and is consistent
changing shape of a gamma ray curve, opposite a sharply (this is discussed further in Chapter 11, Section 11.4).
defined bed, as logging speed is increased. At a properly In an effort to deal scientifically with the bed boundary
selected logging speed and time constant (log 1, Figure problem, logs may be squared or blocked by computer.
2.13), the log gives a reasonable resolution of the bed That is, the computer is programmed to eliminate the
boundaries and the shoulder effects are moderate, about 25 shoulder effects which occur on the logs between beds of
cm either side of the sharp bed boundaries (for the differing values. Log curves are resolved into zones of
example). Within the bed, true bed values are observed. constant value, separated by horizontal ‘boundaries’: they
When the logging speed is increased, the bed appears to be become more ‘bed-like’ in appearance (Figure 2.14). The
located higher than the reality and the shoulder effects are usual method requires the squared log to be a true
significantly increased, albeit asymmetrically (log 2, Figure reflection of the raw log, but with transition zones or
2.13). At higher speeds still, the bed appears to be located ramps eliminated. The exercise is one of reassignment of
even higher than is the case and true bed values are not the transition zone values to pre-designated blocks of
reached, the true bed response being saturated by the even real, non-transition values (Griffiths, 1982) (Figure 2.14).
greater, asymmetric shoulder effects (log 3, Figure 2.13). The algorithm applied assumes that the original log
For the gamma ray, the averaging effects of a moving values are adequate.
16