Page 31 - The Geological Interpretation of Well Logs
P. 31

-  TEMPERATURE  LOGGING  -


                             60°N
                                         |         y\              Norwoy


                            sf  LE  A                     Leet  2D

                                               »                39


                                            =      .              es      Denmark
                                                         a  CC
                             °
                                               —

                                      “J
                                               os
                                                           I
                           56°N   w

                                               25          30
                                     )  i!           A   \

                                                               28
                                                            \
                                        i
                                              A  [h
                                                      as
                                         7
                                           ANAND


                                  Britain                         50              y
                                                             \       35     as   2:  a
                                                     35  \  30       $40        on
                         52°N                                 C        -        Z
                                             f                        25
                                                                 25                   ;
                                    <                                           35
                                2°w      0?      2°e     4°E     6°E      8°E    IO°E
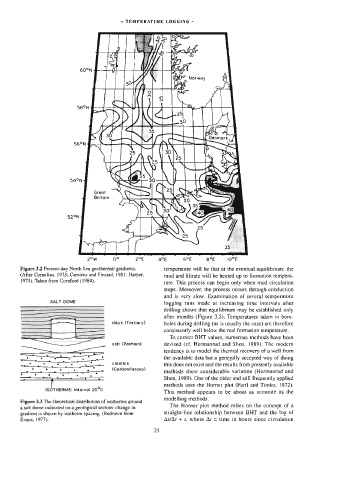
        Figure  3.2  Present-day  North  Sea  geothermal  gradients.   temperature  will  be  that  at  the  eventual  equilibrium:  the
        (After  Comelius,  1975;  Carstens  and  Finstad,  1981;  Harper,   mud  and  filtrate  wil]  be  heated  up  to  formation  tempera-
        1971).  Taken  from  Cornford  (1984).             ture.  This  process  can  begin  only  when  mud  circulation
                                                           stops.  Moreover,  the  process  occurs  through  conduction
                                                           and  is  very  slow.  Examination  of  several  temperature
                   SALT  DOME
                                                           logging  runs  made  at  increasing  time  intervals  after

                                                           drilling  shows  that  equilibnhum  may  be  established  only

                                                           after  months  (Figure  3.5).  Temperatures  taken  in  bore-
                                        clays  (Tertiary)   holes  during  drilling  (as  is  usually  the  case)  are  therefore
                                                           consistently  well  below  the  rea!  formation  temperature.
                                                             To,  correct  BHT  values,  numerous  methods  have  been
                                        salt  (Permian)    devised  (cf.  Hermanrud  and  Shen,  1989).  The  modem
                                                           tendency  is  to  mode]  the  thermal  recovery  of  a  well  from

                                                           the  available  data  but  a  generally  accepted  way  of  doing
                                        clastics           this  does  not  exist  and  the  results  from  presently  available
                                        (Carboniferous)    methods  show  considerable  variation  (Hermanrud  and
                                                           Shen,  1989).  One  of  the  ojder  and  still  frequently  applied

                                                           methods  uses  the  Horner  pijot  (Fert)  and  Timko,  1972).
                 {SOTHERMS:  interval  20°C
                                                           This  method  appears  to  be  about  as  accurate  as  the
                                                           modelling  methods.
        Figure  3.3  The  theoretical  distribution  of  isotherms  around
        a  salt  dome  indicated  on  a  geological  section:  change  in   The  Horner plot method  relies  on  the  concept  of  a
        gradient  is  shown  by  isotherm  spacing.  (Redrawn  from   straight-line  relationship  between  BHT  and  the  log  of
        Evans,  1977).                                     Ar/Ar  +  14,  where  Af  =  time  in  hours  since  circulation
                                                       2}
   26   27   28   29   30   31   32   33   34   35   36