
Page 32 - The Geological Interpretation of Well Logs
P. 32
- THE GEOLOGICAL INTERPRETATION OF WELL LOGS -
Time after circulailon
TEMPERATURE SURVEY (1) 8.5h
(2) 37.6h
{3) 2 months
(4) 4 months
2860m 1000 5
differemtat &
L— temperature £
2880m
— {rate of change) ¢
3
: 2000 +
2900m
T
—T
T
A
T
z
3000
70 100 150 200 260
absolute temperature
temperature °C
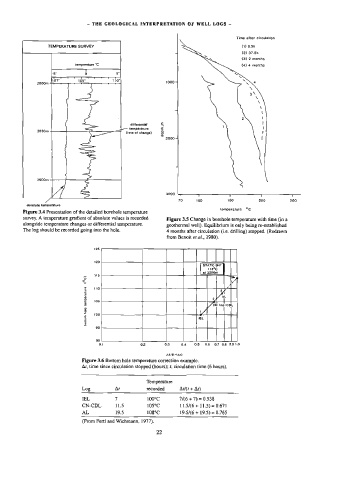
Figure 3.4 Presentation of the detailed borehole temperature
survey. A temperature gradient of absolute values is recorded Figure 3.5 Change in borehole temperature with time (in a
alongside temperature changes or differential temperature.
geothermal well). Equilibrium is only being re-established
The log should be recorded going into the hole. 4 months after circulation (i.e. drilling) stopped. (Redrawn
from Benoit e7 al., 1980).
925
120
STATIC BHT
114°C
418 at 3200m
S “Te
2 ¢
~ A
2 5 ZL
110 ay
ik
o 2
e505
2
CN leg-CDL
D2
2 1 Y
& 100
3 1EL
3
a]
95
$0
01 02 0.3 0.4 0.6 08 OF 08 OF 1.0
Ati(t+an
Figure 3.6 Bottom hole temperature correction example.
As, time since circulation stopped (hours); 7, circulation time (6 hours).
Temperature
Log At recorded Athi + At)
IEL 7 190°C 7HK6 + 7) = 0.538
CN-CDL 11.5 105°C 11.546 + 11.5) = 0.671
AL 19.5 108°C 19.56 + 19.5) = 0.765
(From Fert! and Wichmann, 1977).
22