
Page 34 - The Geological Interpretation of Well Logs
P. 34
- THE GEOLOGICAL INTERPRETATION OF WELL LOGS -
Age-tima
[testing
[_Creteceous
—Jurassic
Trias | | ry
[t[mful] etc fo
Ma 200 750 TOO 50 ,
—_— =a La
Immature
4625
km °C 30°C/km 8hz pris BAe pynnns
-—
Depth Temperature = gradient 1650
aa
“~~
1676
wn
=
£
©
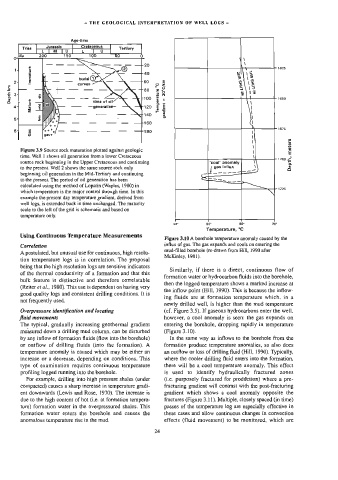
Figure 3.9 Source rock maturation plotted against geologic - €
ale
time. Well ] shows oil generation from a lower Cretaceous
-
1700 =
source rock beginning in the Upper Cretaceous and continuing ‘cool’ anamaly a
to the present. Well 2 shows the same source rock only as influx \ a
I I | 6
beginning oi] generation in the Mid-Tertiary and continuing - —_we ee |
to the present. The period of oil generation has been
-——— —. ——
calculated using the method of Lopatin (Waples, 1980) in
N
1725
which temperature is the major control through time. In this
example the present day temperature gradient, derived from
well logs, is extended back in time unchanged. The maturity
scale to the left of the grid is schematic and based on
temperature only.
B5° 60° 66° 70°
Temperature, °C
Using Continuous Temperature Measurements
Figure 3.10 A borehole temperature anomaly caused by the
Correlation influx of gas. The gas expands and cools on entering the
mud-filled borehote (re-drawn from Hill, 1990 after
A postulated, but unusual use for continuous, high resolu-
McKinley, 1981).
tion temperature logs is in correlation. The proposal
being that the high resolution logs are sensitive indicators
Similarly, if there is a direct, continuous flow of
of the thermal conductivity of a formation and that this
formation water or hydrocarbon fluids into the borehole,
bulk feature is distinctive and therefore correlatable
then the logged temperature shows a marked increase at
(Reiter et a/., 1980). This use is dependent on having very
the inflow point (Hill, 1990). This is because the inflow-
good quality logs and consistent drilling conditions. It is
ing fluids are at formation temperature which, in a
not frequently used.
newly drilled well, is higher than the mud temperature
Overpressure identification and locating (cf. Figure 3.5). If gaseous hydrocarbons enter the well,
fluid movements however, a cool anomaly is seen: the gas expands on
The typical, gradually increasing geothermal gradient entering the borehole, dropping rapidly in temperature
measured down a drilling mud column, can be disturbed (Figure 3.10).
by any inflow of formation fluids (flow into the borehole) In the same way as inflows to the borehole from the
or outfiow of drilling fluids (into the formation). A formation produce temperature anomalies, so also does
temperature anomaly is caused which may be either an an outflow or loss of drilling fluid (Hill, 1990). Typically,
increase or a decrease, depending on conditions. This where the cooler drilling fluid enters into the formation,
type of examination requires continuous temperature there will be a cool temperature anomaly. This effect
profiling logged running into the borehole. is used to identify hydraulically fractured zones
For example, drilling into high pressure shales (under (i.e. purposely fractured for prodifction) where a pre-
compacted) causes a sharp increase in temperature gradi- fracturing gradient will contrast with the post-fractunng
ent downwards (Lewis and Rose, 1970). The increase is gradient which shows a cool anomaly opposite the
due to the high content of hot (i.e. at formation tempera- fractures (Figure 3.11). Multiple, closely spaced (in time)
ture) formation water in the overpressured shales. This passes of the temperature log are especially effective in
formation water enters the borehole and causes the these cases and allow continuous changes in convection
anomalous temperature rise in the mud. effects (fluid movement) to be monitored, which are