
Page 33 - The Geological Interpretation of Well Logs
P. 33
- TEMPERATURE LOGGING -
6 temperature °C 100 150 Environmental correction is a basic but essential use
9 4 1 1 1 } 1 1 1 4 1 » 4 L 4
for temperature measurements: generally BHT values
depth .m ~q———_ $a water 10° suffice but continuous logs will give more accuracy.
Thermal maturation of organic matter
Perhaps the best known use of borehole temperature
measurements, simply as BHT values, is for calculating
1000 +
organic matter maturity. Landes (1967) proposed that
there was a fairly strict relationship between thermal
gradient, depth and hydrocarbon type. The modern view
is to interpret this relationship in terms of hydrocarbon
\ Horner plot
“Od correcled
BHTs generation and maturity. It is certain that simply plotting
2000 4 temperature against depth (and pressure), allows typical
expected hydrocarbon depth ranges to be defined (Figure
3.8). However, these pfots define an effect rather than a
maximum
recorded cause and anomalies often occur, hydrocarbons being
BHTs
found in deeper or hotter reservoirs than they ‘should’.
gradient 9F/100'
3000 5 o 1.0 1.2 4.4 1.6 18 2.0 Om
4000 *« aid 2S0°F (1219S)
and 428
[ ———J 200°F (93°C)
oh
a ae
300°F (149°C)
vight of 28
a
350°F (477°C)
depth ,tt 400°F (204°C)
T
T
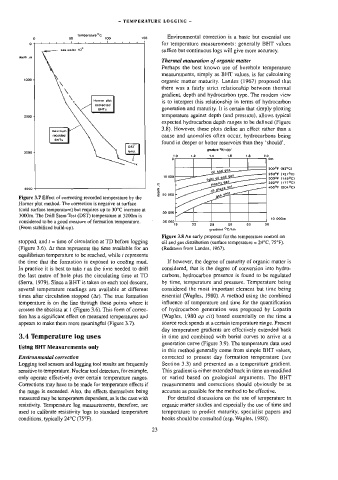
Figure 3.7 Effect of correcting recorded temperature by the
Horner plot method, The correction is negative at surface
{cold surface temperature) but requires up to 30°C increase at
3000m. The Drill Stem Test (DST) temperature a1 3200m is
considered to be a good measure of formation ternperature. 10 000m
22 25 29 33 36
(From stabilized build-up). gradient SCrkm
Figure 3.8 An early proposal for the temperature control on
stopped, and ¢ = time of circulation at TD before logging oil and gas distribution (surface temperature = 24°C, 75°F).
(Figure 3.6). Ar then represents the time available for an (Redrawn from Landes, 1967).
equilibrium temperature to be reached, while 1 represents
the time that the formation is exposed to cooling mud. If however, the degree of maturity of organic matter is
In practice it is best to take ¢ as the time needed to drill considered, that is the degree of conversion into hydro-
the last metre of hole plus the circulating time at TD carbons, hydrocarbon presence is found to be regulated
(Serra, 1979). Since a BHT is taken on each too] descent, by time, temperature and pressure. Temperature being
several temperature readings are available at different considered the most important element but time being
times after circulation stopped (Ar). The true formation essential (Waples, 1980), A method using the combined
temperature is on the line through these points where it influence of temperature and time for the quantification
crosses the abscissa at | (Figure 3.6). This form of correc- of hydrocarbon generation was proposed by Lopatin
tion has a significant effect on measured temperatures and (Waples, 1980 op cit) based essentially on the time a
appears to make them more meaningful (Figure 3.7). source rock spends at a certain temperature range. Present
day temperature gradients are effectively extended back
3.4 Temperature log uses in ime and combined with burial curves to arrive at a
generation curve (Figure 3.9). The temperature data used
Using BHT Measurements only
in this method generally come from simple BHT values,
Environmental correction corrected to present day formation temperature (see
Logging tool sensors and logging too] results are frequently Section 3.3) and presented as a temperature gradient.
sensitive to temperature. Nuclear tool detectors, for example, This gradient is either extended back in time un-modified
only operate effectively over certain temperature ranges. or varied based on geological arguments. The BHT
Corrections may have to be made for temperature effects if measurements and corrections should obviously be as
the range is exceeded. Also, the effects themselves being accurate as possible for the method to be effective.
measured may be temperature dependent, as is the case with For detailed discussions on the use of temperature in
resistivity. Temperature log measurements, therefore, are organic matter studies and especially the use of time and
used to calibrate resistivity logs to standard temperature temperature to predict matunty, specialist papers and
conditions, typically 24°C (75°F). books should be consulted (esp. Waples, 1980).
23