
Page 236 - The Geological Interpretation of Well Logs
P. 236
14
FACIES, SEQUENCES AND
DEPOSITIONAL ENVIRONMENTS
FROM LOGS
14.1 Introduction resistivity log. The principal shapes observed were the
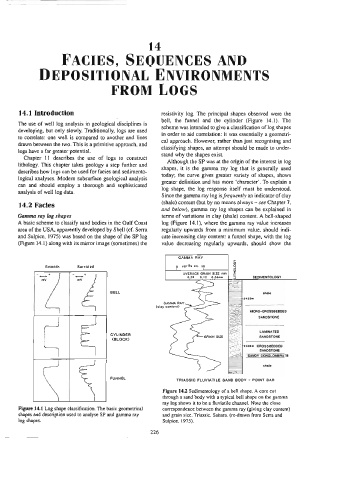
belt, the funnel and the cylinder (Figure 14.1). The
The use of well Jog analysis in geological disciplines is
scheme was intended to give a classification of log shapes
developing, but only slowly. Traditionally, logs are used
in order to aid correlation: it was essentially a geometri-
to correlate: one well is compared to another and lines
ca) approach. However, rather than just recognising and
drawn between the two. This is a pnmitive approach, and
classifying shapes, an attempt should be made to under-
logs have a far greater potential.
stand why the shapes exist.
Chapter 1] describes the use of logs to construct
Although the SP was at the origin of the interest in log
lithology. This chapter takes geology a step further and
shapes, it is the gamma ray log that is generally used
describes how logs can be used for facies and sedimento-
today; the curve gives greater variety of shapes, shows
logical analyses. Modem subsurface geological analysis
greater definition and has more ‘character’. To explain a
can and should employ a thorough and sophisticated
log shape, the log response itself must be understood.
analysis of well log data.
Since the gamma ray log is frequently an indicator of clay
(shale) content (but by no means always — see Chapter 7,
14.2 Facies
and below), gamma ray log shapes can be explained in
Gamma ray log shapes terms of variations in clay (shale) content. A bell-shaped
A basic scheme to classify sand bodies in the Gulf Coast log (Figure 14.1), where the gamma ray value increases
area of the USA, apparently developed by Shell (cf. Serra regularly upwards from a minimum value, should indi-
and Sulpice. 1975) was based on the shape of the SP log cate increasing clay content: a funnel shape, with the log
(Figure 14.1} along with its mirror image (sometimes) the value decreasing regularly upwards, should show the
GAMMA RAY
§ rgrRa eq, 10
Smooth Serrated LITHOLOGY
AVERAGE GRAIN SIZE mm
- * - +
te _ 0.28 O12 2.06mm SEDIMENTOLOGY
m¥ my
ITA (i oy
BELL shale
GAMMA RAY
(clay conten)
MICRO-CROSSBEDDED
SANDSTONE
CYLINDER “~— GAAIN SIZE LAMINATED
.
SANDSTONE
~~ "b2sssm CROSSBEDDED
(BLOCK)
SANDSTONE
\| _SANDY CONGLOMERATE
shaie
FUNNEL Figure 14.2 Sedimentology of a bell shape. A core cut
TRIASSIC FLUVIATILE SAND BODY - POINT BAR
through a sand body with a typical bell shape on the gamma
ray log shows it to be a fluviatile channel. Note the close
Figure 14.1 Log shape classification. The basic geometrical correspondence between the gamma ray (giving clay content)
shapes and description used to analyse SP and gamma ray and grain size, Triassic, Sahara. (re-drawn from Serra and
log shapes. Sulpice, 1975).
226