
Page 233 - The Geological Interpretation of Well Logs
P. 233
- IMAGE LOGS -
diameter (cm) =~
6 8 190 12 14 16
70 T T T T T YS
single paint |S
_ resistivity <2 .
— caliper i increasing >
x t resistance ‘
= i
Q i
a ‘
uc S =z
non-producing ( em
75 FRACTURE Le sr 4
induced pe eee
fracture ractures : >
on image lag i
N.
+
80° 10° PRODUCING “ .
270° x 10°
sob FRACTURE a 4
at ee = 27cm ire
4 O 90 180 270 360
4
ae
”
_
i
86
L
i
!
L
=
1400 1600 1800 2000 2200
Neutron counts per second
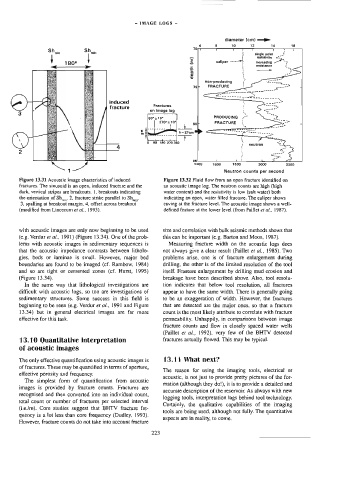
Figure 13,31 Acoustic image chacteristics of induced Figure 13.32 Fluid flow from an open fracture identified on
fractures. The sinusoid is an open, induced fracture and the an acoustic image log. The neutron counts are high (high
dark, vertical stripes are breakouts. 1, breakouts indicating water content) and the resistivity is low (salt water) both
the orientation of Sh_,.. 2, fracture strike parallel to Sh,,,. indicating an open, water filled fracture. The caliper shows
3, spalling at breakout margin. 4, offset across breakout caving at the fracture level. The acoustic image shows a well-
{modified from Lincecum e7 af, 1993). defined feature a1 the lower level (from Paillet ef at., 1987).
with acoustic images are only now beginning to be used size and correlation with bulk seismic methods shows that
(e.g. Verdur er ai., 1991) (Figure 13.34). One of the prob- this can be important (e.g. Barton and Moos, 1987).
lems with acoustic images in sedimentary sequences is Measuring fracture width on the acoustic logs does
that the acoustic impedance contrasts between lithalo- not always give a clear result (Paillet et af, 1985). Two
gies, beds or laminae is small. However, major bed problems arise, one is of fracture enlargement during
boundanes are found to be imaged (cf. Rambow, 1984) drilling, the other is of the limited resolution of the tool
and so are tight or cemented zones (cf. Hurst, 1995) itself. Fraature enlargement by drilling mud erosion and
(Figure 13.34}. breakage have been described above. Also, tool resolu-
In the same way that lithological investigations are tion indicates that below tool resolution, all fractures
difficult with acoustic logs, so too are investigations of appear to have the same width. There is generally going
sedimentary structures. Some success in this field is to be an exaggeration of width. However, the fractures
beginning to be seen (e.g. Verdur et a/., 1991 and Figure that are detected are the major ones, so that a fracture
13,34) but in general electrical images are far more count is the most likely attribute to correlate with fracture
effective for this task. permeability. Unhappily, in comparisons between image
fracture counts and flow in closely spaced water wells
(Pailtet er ai, 1992), very few of the BHTV detected
13.10 Quantitative interpretation fractures actually flowed. This may be typical.
of acoustic images
The only effective quantification using acoustic images is 13.11 What next?
of fractures. These may be quantified in terms of aperture,
The reason for using the imaging tools, electrical or
effective porosity and frequency.
acoustic, is not just to provide pretry pictures of the for-
The simplest form of quantification from acoustic
mation (although they do!), it is to provide a detailed and
images is provided by fracture counts. Fractures are
accurate description of the reservoir. As always with new
recognised and then converted into an individual count,
logging tools, interpretation lags behind tool technology.
total count or number of fractures per selected interval
Certainly, the qualitative capabilides of the imaging
(i.e./m). Core studies suggest that BHTV fracture fre-
tools are being used, although not fully. The quantitative
quency is a lot less than core frequency (Dudley, 1993).
aspects are in reality, to come.
However, fracture counts do not take into account fracture 223