
Page 230 - The Geological Interpretation of Well Logs
P. 230
- THE GEOLOGICAL INTERPRETATION OF WELL LOGS -
(13.5 lbs/gal) and 1.25 gem? (10.5 lbs/gal) in 12.25" Table 13.6 CBIL theoretical signal attenuation related to mud
holes. However, such strict limits are not indicative, as weight and hole size. Signal Joss in decibels. Barite oil-base
mud (after Faraguna et af., 1989).
much depends on the acoustic impedance between the
mud and the formation (see below). It is certain that the
too] should generally not be used in mud weights above Mud Weight Hole Diameter
1.7 gem*-1.9 gem? (15-16 Ibs/gal), even with CBiL gicm? —Ibs/gal 84" 12%" 174"
which has lower operating frequencies.
1.08 9.0 *.7.5 *.12.5 *-20.0
— acoustic impedance contrast 1.44 12.0 *-14.4 *.25.6 40.6
For there to be a significant reflection of pulse energy at 1.80 15.0 *-22.5 -38.5 -60.6
the borehole wall, there must be an acoustic impedance
contrast between the mud and the formation. For this *acceptable signal. No star, signal not acceptable
reason, the acoustic imaging tools are traditionally used
in ‘hard’ formations such as limestones or older rocks
(and crystalline rocks for the non-hydrocarbon indus- 13.8 Acoustic imaging tool
tries). However, it is equally true that strong acoustic
interpretation, generalities
impedance between formations produces viable images.
This is well illustrated by the use of the tools in the coal Acoustic imaging tools are used to provide high quality
industry (Rilbel et ai., [986): coal has big impedance dip and azimuth measurements, to investigate fractures,
contrasts with other lithologies. to provide information on borehole breakouts and to
some extent to give information on lithological bound-
- borehole surface aries, textures and some sedimentary features. By far the
In the same way that borehole geometry affects the commonest use of the acoustic imaging tools to date, has
strongly focused acoustic beam, so also does the reflec- been to investigate fractures.
tivity, the topography of the actual surface of the borehole
wall. That is, good reflection will come from a smooth — display and manipulation
surface, any roughness will cause scatter and reduce the The use of a workstation for acoustic log interpretation
energy of the reflected signal. Thus, acoustic images is standard. The two log processings, as described, are
show scratches left by the bit on the borehole wall, or displayed side by side so that they may be compared.
zones of wall breakage (spalling). Such effects may Typically, the amplitude scale uses the lighter colours or
dominate an image. However, usefully, fractures and shades for large amplitudes and black for zero amplitude
other natural features such as breakouts will also be seen (Figure 13.28). The time of flight scale is from near
for the same reason (Section 13.9). reflection darker shades to far reflection or none at all
(light). The polar caliper from the time of flight can be
displayed simultaneously in a comer of the screen,
Helpfully, the images will be displayed with standard
logs and possibly caliper traces (Figure 13.28).
A. CIRCULAR BOREHOLE
Acoustic image display software usually incorporates
CENTRED TOOL OFF-CENTRED TOOL
enhancing routines which can be used during interpreta-
lion as needed, These routines are helpful in taking out
unwanted artifacts caused for the most part by hole
geometry.
Sine wave fitting routines for measuring dip and
azimuth are the same for the acoustic tools as for the
electrical tools. Dip and azimuth are displayed on screen
and features may be annotated. One development which
B. ELLIPTICAL BOREHOLE
seems more common with the acoustic logs, is software
CENTRED TOOL OFF-CENTRED TOOL
‘able to work through an entire log, picking image sine
wave dip and azimuth measurements automatically (e.g.
Torres er al., 1990). Orientation classification and identi-
fication routines are as for the electrical images.
— amplitude versus time of flight
The juxtaposition of the two acoustic image logs, the
reflected amplitude, or reflectance and the travel time to
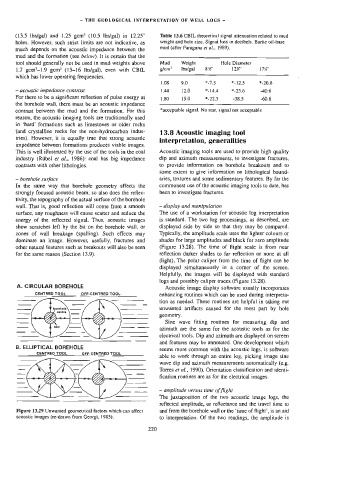
Figure 13.29 Unwanted geometrical factors which can affect and from the borehole wall or the ‘time of flight’, is an aid
acoustic images (re-drawn from Georgi, 1985). to interpretation. Of the two readings, the amplitude is