
Page 226 - The Geological Interpretation of Well Logs
P. 226
- THE GEOLOGICAL INTERPRETATION OF WELL LOGS -
Without descending into details, images are analysed
to identify individual vugs, to define their size and their
shape from which a porosity can be inferred. That is, the
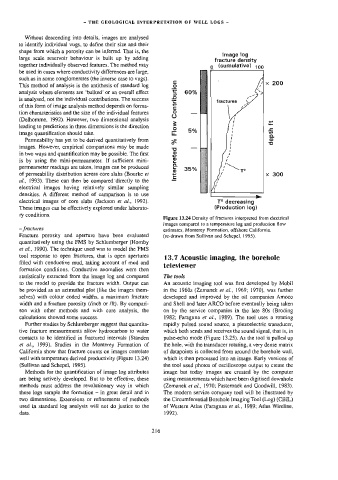
Image log
large scale reservoir behaviour is built up by adding
fracture density
together individually observed features. The method may o (cumulative) 199
be used in cases where conductivity differences are large,
such as in some conglomerates (the inverse case to vugs).
This method of analysis is the antithesis of standard log x 200
analysis where elements are ‘bulked’ or an overall effect 60% |
is analysed, not the individual contributions. The success Contribution
of this form of image analysis method depends on forma-
tion characteristics and the size of the individual features
(Delhomme, 1992). However, two dimensional analysis
leading to predictions in three dimensions is the direction Flow 2
image quantification should take. 5% =
a
Permeability has yet to be derived quantitatively from % @
images. However, empirical comparisons may be made 3
in two ways and quantification may be possible. The first
is by using the mini-permeameter. If sufficient mini- Interpreted 35%
densities. A different method of camparison is to use x 300
permeameter readings are taken, images can be produced
of permeability distribution across core slabs (Bourke et
al., 1993). These can then be compared ‘directly to the
electrical images having relatively similar sampling
electrical images of core slabs (Jackson et ail., 1992).
T° decreasing
These images can be effectively explored under laborato- (Production log)
ry conditions.
Figure 13.24 Density of fractures interpreted from electrical
images compared to a temperature log and production flow
— fractures estimates, Monterey Formation, offshore California.
Fracture porosity and aperture have been evaluated (re-drawn from Sullivan and Schepe], 1995).
quantitatively using the FMS by Schlumberger (Hornby
et al., 1990). The technique used was to model the FMS
tool response to open fractures, that is open apertures
13.7 Acoustic imaging, the borehole
filled with conductive mud, taking account of mud and
televiewer
formation conditions. Conductive anomalies were then
statistically extracted from the image log and compared The tools
to the model to provide the fracture width. Output can An acoustic imaging tool was first developed by Mobil
be provided as an azimuthal plot (like the images them- in the 1960s (Zemanek ef ai., 1969; 1970), was further
selves) with colour coded widths, a maximum fracture developed and improved by the oil companies Amoco
width and a fracture porosity (/inch or /ft). By compari- and Shell and later ARCO before eventually being taken
son with other methods and with core analysis, the on by the service companies in the late 80s (Broding
calculations showed some success. 1982; Faraguna ef al., 1989). The tool uses a rotating
Further studies by Schlumberger suggest that quantita- rapidly pulsed sound source, a piezoelectric transducer,
tive fracture measurements allow hydrocarbon to water which both sends and receives the sound signal, that is, in
contacts to be identified in fractured intervals (Standen pulse-echo mode (Figure 13.25). As the tool is pulled up
et al., 1993). Studies in the Monterey Formation of the hole, with the transducer rotating, a very dense matrix
California show that fracture counts on images correlate of datapoints is collected from around the borehole wall,
well with temperature derived productivity (Figure 13.24) which is then processed into an image. Early versions of
(Sullivan and Schepel, 1995). the tool used photos of oscilloscope output to create the
Methods for the quantification of image log attributes image but today images are created by the computer
are being actively developed. But to be effective, these using measurements which have been digitised downhole
methods must address the revolutionary way in which (Zemanek et ai., 1970; Pasternack and Goodwill, 1983).
these logs sample the formation — in great detail and in The modern service company tool will be illustrated by
two dimensions. Extensions or refinements of methods the Circumferential Borehole Imaging Too] (Log) (CBIL)
used in standard log analysis will not do justice to the of Western Atlas (Faraguna et a/., 1989; Atlas Wireline,
data. 1992).
216