
Page 223 - The Geological Interpretation of Well Logs
P. 223
- IMAGE LOGS -
the image set to imitate the SHDT and, using the FMI PAD AZIMUTH
ortentation and caliper data, can be processed as a dip- 180 N 40 300 360 60 120 180
meter. For structural use, typical structural parameters SOUTH WEST NORTH EAST SOUTH
'
are chosen of 1.0 m correlation interval and 0,5 m step
distance (Chapter 12). The resulting dipmeter provides a
good structural dip and allows the interpreter to ‘stand 1 ' k
,
back’ from the overwhelming and, for structural analysis,
unnecessary detai] of the image derived measurements A
(Figure 13.18). These dipmeter results can be used for
2842 m+
siructura] rotation, unconformity recognition and fault
location. x
z 9 ;, Qo
A unique etement of the interpretation for unconformi- Ws
ties and disconformities with the image logs, is that the
surface itself can be examined. The actual level of an
unconformity can be examined for diagenetic effects,
abrupt changes in image facies and biological activity as SO
welt as the angular change (Figure 13.19). Such details
are also helpful in sequence stratigraphic analysis, as
\
image features around important stratigraphic surfaces
are often very distinctive.
wR
~ fractures and faults
The detection of fractures and eventually faults is a
5
fundamental objective of the image logs, traditionally 2,
more so for the acoustic images than for the electrical == KS
images. Fractures are never satisfactorily cored so that to
be able to see them in situ using the image logs, and to
measure their attitude accurately, is invaluable. However,
2843 m4
frequently there is difficulty in recognising fractures and WACaR
certainly in recognising faults (Table 13.4). The difficul-
ty with fractures depends very much on the sequence and
lithology. For example in sand-shale sequences, sedimen-
tary responses tend to dominate while in carbonates,
fractures are often more easily identified.
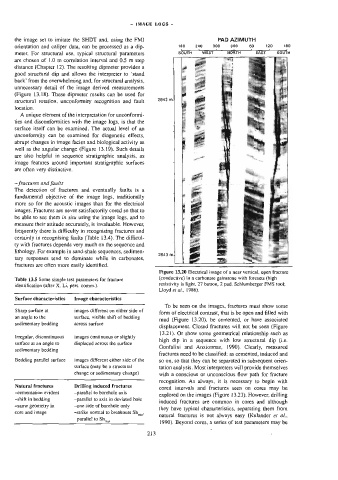
Figure 13.20 Electrical image of a near vertical, open fracture
(conductive) in a carbonate gainstone with foresets (high
Table 13.5 Some simple test parameters for fracture
resistivity is light, 27 button, 2 pad, Schlumberger FMS tool;
identification (after X. Li, pers. comm.).
Lloyd et af, 1986).
Surface characteristics Image characteristics
To be seen on the images, fractures must show some
Sharp surface at images different on either side of
form of electrical contrast, that is be open and filled with
an angle to the surface, visible shift of bedding
mud (Figure 13.20), be cemented, or have associated
sedimentary bedding across surface
displacement. Closed fractures will not be seen (Figure
13.21). Or show some geometrical relationship such as
Irregular, discontinuous images continuous or slightly
high dip in a sequence with tow structural dip (ie.
surface al an angle to displaced across the surface
Gonfalini and Anxionnaz, 1990). Clearly, measured
sedimentary bedding
fractures need to be classified: as cemented, induced and
Bedding parallel surface images different either side of the so on, so that they can be separated in subsequent orten-
surface (may be a structural tation analysis. Most interpreters will provide themselves
change or sedimentary change)
with a conscious or unconscious flow path for fracture
recognition. As always, it is necessary to begin with
Natural fractures Drilling induced fractures
cored intervals and fractures seen on cores may be
—cementation evident —paralle] to borehole axis
explored on the images (Figure 13.21). However, drilling
shift in bedding -parallel to axis in deviated hole
induced fractures are common in cores and although
-same geometry in —one side of borehole only
they have typical characteristics, separating them from
core and image -strike normal to breakouts Sh
mia?
natural fractures is not always easy (Kulander er ai.,
parallel to Sh__.
1990). Beyond cores, a series of test parameters may be
213 ‘